
Metric Formula Examples
Learn how to write metric formulas by following along with these examples.
Overview
This topic contains a series of different metric examples that each become more complex or build on the previous example. We will start with Headcount, a comparatively simple metric that counts current employees, and then explore more complex examples thereafter. Each example answers the Questions to consider to prepare for writing the formula.
Tip: To follow along with these examples, we recommend you have an understanding of metrics and metric formulas. For more information, see Work With Metrics.
While following along with these examples, remember:
- Use object names in formulas. For more information, see Basic information (optional).
- If using the object's default time handling, you can omit it from the formula. The platform will apply the default time handling at run time.
- Subjects: Default time handling is
validUntil instant, which queries the state at the selected time. - Events: Default time handling is
occurredIn interval, which queries over the entire selected interval.
- Subjects: Default time handling is
- In the formula, you might specify an attribute's qualified name. The qualified name defines the attribute name and its parent analytic object; for example,
Current Employeeis an attribute ofEmployee, so its qualified name isEmployee.Current_Employee. Use the following guidelines to decide if you should specify an object's qualified name:- If the metric formula only uses one analytic object, you can optionally omit the attribute's qualified name because the formula already specifies the analytic object. For example: Copy
on Employee filterBy(isActiveEmployee) aggregate count(EmployeeID)Alternatively, you can write the same formula with qualified names:
Copyon Employee filterBy(Employee.isActiveEmployee) aggregate count(Employee.EmployeeID) If the metric formula uses multiple analytic objects, you must specify qualified names for attributes that aren't associated with the primary analytic object so that the platform knows how to execute the formula. For example:
Copyon Hire occurredIn interval aggregate average(daysBetween(Applicant.Requisition.Approved_Date, effectiveDate, gregorian))In this formula,
Hireis the primary analytic object, however,Approved_Dateis associated with a different analytic object (RequisitionthroughApplicant), so we must specify the qualified name forApproved_Date.
- If the metric formula only uses one analytic object, you can optionally omit the attribute's qualified name because the formula already specifies the analytic object. For example:
- Data types and additivity are set in a metric's Settings tab, not in the formula.
Count examples
In this section, follow along with examples that use the count aggregation function. Count metrics get the total number for a certain population, such as all active employees or all employees who were promoted during the period.
Headcount
This example highlights a simple metric that follows the standard formula syntax.
First, let's decide what the metric calculates and how to execute the calculation.
- We want to answer the question "How many employees are in my organization?" for HR leaders.
- Headcount calculates data from the
Employeesubject. - Headcount selects current employees. We don't want to count inactive or exited employees. It counts each unique employee ID for employees whose data indicates they are actively employed. In Visier, current employees is a concept with the object name
isActiveEmployee. - Headcount calculates all records that meet the requirements of the formula at the end of the selected time period. If an employee left the organization at some point during the selected time period, the record doesn't meet the formula requirements and won't be included in the count. We can use
validUntil instanttime handling. - Headcount is a
count. We want to know the total number of unique employees. In Visier, each employee record has a unique ID in theEmployeeIDproperty. - Headcount returns values in integers. We want a whole number without any decimals when counting our employee headcount, so Integer is the data type.
- Headcount is Additive because it can be summed over any dimension or concept, like summing the count of part-time employees who are women. It is not additive over time because we don't want to add the headcount from multiple time periods together; for example, Headcount in January was 300 and Headcount in February was 305. We don't want to see a Headcount value of 605 for January and February.
Next, we can plug values into the standard formula syntax: on <subject//event> <time handling> filterBy(<filter condition>) aggregate <function>(<aggregation property>)
<subject//event>: Employee<time handling>: validUntil instant<filter condition>: isActiveEmployee<function>: count<aggregation property>: EmployeeID
Put together:
on Employee filterBy(isActiveEmployee) aggregate count(EmployeeID)Note:
- In this example, we're using the default time handling for a subject, so we'll omit it from the final formula.
- This formula uses one analytic object so we don't have to specify qualified names.
And we're done! Preview the metric to validate that it works as expected, then publish the metric to production.
Tip: You can apply this formula logic to any subject that you want a total count of valid records at the end of a selected time period. For example:
Employee with Promotions Count
This example highlights a simple metric that follows the standard formula syntax.
First, let's decide what the metric calculates and how to execute the calculation.
- We want to answer the question "How many of my current employees were promoted recently?".
- Employee with Promotions Count calculates data from the
Employeesubject. - Employee with Promotions Count selects current employees who had promotion events. We don't want to count inactive employees or employees who didn't get promoted. It counts each unique employee ID for employees whose data indicates they are actively employed and had a promotion event. In Visier, current employees is a concept with the object name
isActiveEmployeeand employees with promotion events is a concept with the object nameisPromotionEventEmployees. - Employee with Promotions Count calculates all records that are valid at the end of the selected time period. If an employee left the organization at some point during the selected time period, we don't want to include them in the count. We can use
validUntil instanttime handling. - Employee with Promotions Count is a
count. We want to know the total number of unique employees who were promoted. In Visier, each employee record has a unique ID in theEmployeeIDproperty. - Employee with Promotions Count returns values in integers. We want a whole number without any decimals when counting employees that were promoted, so Integer is the data type.
- Employee with Promotions Count is Additive because it can be summed over any dimension or concept, like summing the count of recently promoted part-time employees who are women. It is not additive over time because we don't want to add the Employee with Promotions Count from multiple time periods together; for example, Employee with Promotions Count in January was 300 and Employee with Promotions Count in February was 305. We don't want to see a Employee with Promotions Count value of 605 for January and February.
Next, we can plug values into the standard formula syntax: on <subject//event> <time handling> filterBy(<filter condition>) aggregate <function>(<aggregation property>)
<subject//event>: Employee<time handling>: validUntil instant<filter condition>: isActiveEmployee && isPromotionEventEmployees<function>: count<aggregation property>: EmployeeID
Put together:
on Employee filterBy isActiveEmployee && isPromotionEventEmployees aggregate count(EmployeeID)Note:
- In this example, we're using the default time handling for a subject, so we'll omit it from the final formula.
- This formula uses one analytic object so we don't have to specify qualified names.
And we're done! Preview the metric to validate that it works as expected, then publish the metric to production.
Total Goals Ending in Period
This example highlights a metric that allows users to filter with dates other than the effective date. In this example, we want to select all goals that have an end date between the start of the time period and the end of the time period. In the formula, we can filter by the End Date property of the Employee Goals subject where the goal end date is greater than the start of the period but less than the end of the time.
Let's decide what the metric calculates and how to execute the calculation.
- We want to answer the question "How many goals are expiring during the period?".
- Total Goals Ending in Period calculates data from the
Employee_Goalssubject. - Total Goals Ending in Period calculates all records that are valid at the end of the selected time period. We can use
validUntil instanttime handling. - Total Goals Ending in Period selects all employees that have a goal expiring. In Visier,
Employee_Goalshas a property with the object nameEnd_Datewe can use to filter by the selected period. - Total Goals Ending in Period is a
count. We want to know the total number of unique employee goals that are expiring. In Visier, each employee goal has a unique ID in theEmployee_GoalsIDproperty. - Total Goals Ending in Period returns values in integers. We want a whole number without any decimals when counting our employee total goals ending in period, so Integer is the data type.
- Total Goals Ending in Period is Additive over time because we want to add the total goals ending in a period from multiple time periods together. For example, Total Goals Ending in Period filtered by Women in January is 300 and Total Goals Ending in Period filtered by Women in February is 305. We want to see a Total Goals Ending in Period filtered by Women value of 605 for January and February when we select both months.
Next, we can plug values into the standard formula syntax: on <subject//event> <time handling> filterBy(<filter condition>) aggregate <function>(<aggregation property>)
<subject//event>: Employee_Goals<time handling>: validUntil instant<filter condition>: End_Date >= start(periodOf(instant)) && End_Date < end(periodOf(instant))<function>: count<aggregation property>: Employee_GoalsID
Put together:
on Employee_Goals filterBy(End_Date >= start(periodOf(instant)) && End_Date < end(periodOf(instant))) aggregate count(Employee_GoalsID)Note:
- In this example, we're using the default time handling for a subject, so we'll omit it from the final formula.
- This formula uses one analytic object so we don't have to specify qualified names.
And we're done! Preview the metric to validate that it works as expected, then publish the metric to production.
Tip: You can apply this formula logic to any subject that you want a total count of valid records at the end of a selected time period using this filtering ability. For example:
on Employee_Goals validUntil instant filterBy(Employee_Goals.Start_Date >= start(periodOf(instant)) && Employee_Goals.Start_Date <= end(periodOf(instant)) ) aggregate count(Employee_Goals.Employee_GoalsID)This formula counts the number of goals that will start during the period.
Event-based examples
In the previous section, the metrics calculate data from subjects (Employee and Employee_Goals). The metrics in this section calculate data from events. An event occurs at a specific point in time, whereas a subject is active across time. To write a metric formula based on an event, we can follow the same steps as metrics based on a subject.
Retirement Count
This example highlights a metric based on an event.
First, let's decide what the metric calculates and how to execute the calculation.
- We want to answer the question "How many employees left my organization due to retirement?".
- Retirement Count calculates data from the
Employee_Exitevent. - Retirement Count calculates all records that occurred at a selected point in time. If an employee retired in February, we want to include them in February's Retirement Count. We can use
occurredIn intervaltime handling. - Retirement Count selects employees whose exit reason is Retirement. We don't want to count employees who exited for non-retirement reasons, like resignation or termination. In Visier, retirement is a concept with the object name
isExitActualRetirement. - Retirement Count is a
count. We want to know the total number of unique employees that retired from the organization. In Visier, each employee record has a unique ID in theEmployeeIDproperty. - Retirement Count returns values in integers. We want a whole number without any decimals when counting our employee retirements, so Integer is the data type.
- Retirement Count is Additive over time because it can be summed over time, dimensions, and concepts. For example, Retirement Count filtered by Women in January is 300 and Retirement Count filtered by Women in February is 305. We want to see a Retirement Count filtered by Women value of 605 for January and February when we select both months.
Next, we can plug values into the standard formula syntax: on <subject//event> <time handling> filterBy(<filter condition>) aggregate <function>(<aggregation property>)
<subject//event>: Employee_Exit<time handling>: occurredIn interval<filter condition>: isExitActualRetirement<function>: count<aggregation property>: EmployeeID
Put together:
on Employee_Exit filterBy(isExitActualRetirement) aggregate count(EmployeeID)Note:
- In this example, we're using the default time handling for an event, so we'll omit it from the final formula.
- This formula uses
Employee_Exit, which is an event based on theEmployeesubject. As a result, this formula only uses one event,Employee_Exit, so we don't have to specify qualified names forisExitActualRetirementandEmployeeID.
And we're done! Preview the metric to validate that it works as expected, then publish the metric to production.
Tip: You can apply this formula logic to any event that you want a total count of valid records at some point during the selected time period. For example:
on Employee_Exit filterBy(isExitActualResignation) aggregate count(EmployeeID)This formula counts the number of exits due to resignation.
on Employee_Exit filterBy(isExitActualTermination) aggregate count(EmployeeID) This formula counts the number of exits due to termination.
Promotion Events Count
This example highlights the priorState() function to count employee promotions in the context of where the employee was promoted from. The priorState() function returns the data points based on the state prior to the event. In this example, the priorState() function returns an employee's previous job. For example, Bob Smith got promoted in January from People Analyst to Senior People Analyst. If we use this metric to group by Job Name while selecting January as our time period, we would see a Promotion Event Count with Bob's original Job Name which was People Analyst.
First, let's decide what the metric calculates and how to execute the calculation.
- We want to answer the question "How many employees got promoted and what were their job roles before the promotion?"
- Promotion Events Count calculates data from the
Employeesubject using theInternal_Placementevent. We can use thepriorStatefunction withInternal_Placementto get the employee's previous job. - Promotion Events Count calculates all records that occurred at a selected point in time. If an employee got promoted in February, we want to include them in February's Promotion Events Count. We can use
occurredIn intervaltime handling. - Promotion Events Count selects employees who got promoted. We don't want to count employees who didn't get a promotion. In Visier, promotion is a concept with the object name
isPromotion. - Promotion Events Count is a
count. We want to know the total number of unique employees that got promoted and their prior job role before the promotion. In Visier, each employee record has a unique ID in theEmployeeIDproperty. - Promotion Events Count returns values in integers. We want a whole number without any decimals when counting employee promotions, so Integer is the data type.
- Promotion Events Count is Additive over time because it can be summed over time, dimensions, and concepts. For example, Promotion Events Count in January is 20 and Promotion Events Count in February is 25. We want to see a Promotion Events Count value of 45 for January and February when we select both months.
Next, we can plug values into the standard formula syntax: on <subject//event> <time handling> filterBy(<filter condition>) aggregate <function>(<aggregation property>)
<subject//event>: Internal_Placement<time handling>: occurredIn interval<filter condition>: isPromotion<function>: count<aggregation property>: EmployeeID
Put together:
on priorState(Internal_Placement) filterBy(isPromotion) aggregate count(EmployeeID)Note:
- In this example, we're using the default time handling for an event, so we'll omit it from the final formula.
- This formula uses
Internal_Placement, which is an event based on theEmployeesubject. As a result, this formula only uses one event,Internal_Placement, so we don't have to specify qualified names forisPromotionandEmployeeID.
And we're done! Preview the metric to validate that it works as expected, then publish the metric to production.
Tip: You can apply this formula logic to any subject that you want a total count of valid records at the end of a selected time period. For example:
on priorState(Internal_Placement) filterBy(isLateralMove) aggregate count(EmployeeID)This formula counts the employees who moved laterally within the organization in the context of the employee's previous placement.
on priorState(Internal_Placement) filterBy(isDemotion) aggregate count(EmployeeID) This formula counts the employees who were demoted in the context of the role the employee was demoted from.
Parameter examples
Parameters serve as placeholders in a formula. This allows you to create objects that use different variations in a single object.
Parameters can be one of the following types:
- Numeric: A parameter with a numeric data type. A numeric parameter can be set with an optional default value and value range.
- Member: A filter parameter that can be set with optional dimension member selection.
- Aggregation: A parameter that aggregates property values. For events and subjects, the parameter is set on one property using multiple aggregation functions. For overlays, the parameter is set on multiple properties using one aggregation function.
- Plan: A plan parameter that can be used to select a plan and scenario.
-
Subject Member Set: A parameter which allows the user to select a set of subject members as well as hierarchy values associated with those members.
Note: Limited Availability This feature is in limited availability. If you're interested, contact your Customer/Partner Success Manager. Visier Case Managers can request access by submitting an Enable a Feature case.
If you reference a parameterized object in the formula of a different object, you can set its parameters to a specific value in the new formula.
With parameterized variables, your users can dynamically select the attribute of interest to apply to the metric. For more information, see Parameters (optional).
Headcount with Attribute
This example is a continuation of Headcount, but in this example we will show the value of parameterized variables in a metric. In this example, we'll create a parameter that allows users to select any attribute to apply to Headcount; for example, users can use Headcount with Attribute to find out how many managers are in the organization, or how many women, or employees who are in the retirement zone, and so on.
Note: You can also create metrics with parameterized variables solely for design purposes to use in ratio metrics. We will walk through this purpose in the Headcount Ratio example.
First, let's decide what the metric calculates and how to execute the calculation.
- We want to answer the question "How many managers/women/retirement zone employees/… are in my organization?"
- Headcount with Attribute calculates data from the
Employeesubject. - Headcount with Attribute calculates all records that are valid at the end of the selected time period. If an employee left the organization at some point during the selected time period, we don't want to include them in the count. We can use
validUntil instanttime handling. - Headcount with Attribute selects current employees who have a user-selected attribute. In Visier, current employees is a concept with the object name
isActiveEmployee. The user-selected attribute is created as a parameter on the metric. In this example, after creating the Headcount with Attribute metric, we can navigate to the Parameters tab and create a member parameter calledEmployee_Attribute_Parameter. For more information, see Parameters (optional). - Headcount with Attribute is a
count. We want to know the total number of unique employees that have a specific attribute. In Visier, each employee record has a unique ID in theEmployeeIDproperty. - Headcount with Attribute returns values in integers. We want a whole number without any decimals when counting employee headcount, so Integer is the data type.
- Headcount with Attribute is Additive because it can be summed over any dimension or concept, like summing the count of employees who are managers. It is not additive over time because we don't want to add the headcount with attributes from multiple time periods together; for example, Headcount with Attribute in January was 300 and Headcount with Attribute in February was 305. We don't want to see a Headcount value of 605 for January and February when we select both months.
Next, we can plug values into the standard formula syntax: on <subject//event> <time handling> filterBy(<filter condition>) aggregate <function>(<aggregation property>)
<subject//event>: Employee<time handling>: validUntil instant<filter condition>: isActiveEmployee && Employee_Attribute_Parameter<function>: count<aggregation property>: EmployeeID
Put together:
on Employee filterBy(isActiveEmployee && Employee_Attribute_Parameter) aggregate count(EmployeeID)Note:
- In this example, we're using the default time handling for a subject, so we'll omit it from the final formula.
- This formula uses one analytic object so we don't have to specify qualified names.
- The parameter
Employee_Attribute_Parameterallows the user to dynamically select different attributes of interest to analyze different headcounts. In another example, we will use Headcount with Attribute metric as a numerator to calculate Headcount Ratio.
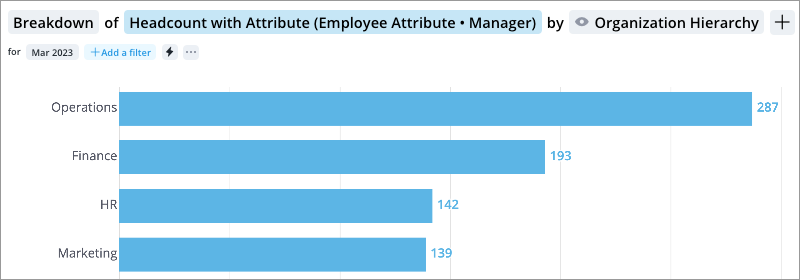
And we're done! Preview the metric to validate that it works as expected, then publish the metric to production. In the following screenshot, you can see Headcount with Attribute in action with the Manager attribute selected.
Tip: You can apply this formula logic to any subject that you want a total count of valid records at the end of a selected time period. For example:
on Employee_Goals filterBy Assigned_Employee.isActiveEmployee && Goal_Attribute_Parameter aggregate count(Employee_GoalsID)on Employee_Goals filterBy isEditedGoal && Assigned_Employee.isActiveEmployee && Goal_Attribute_Parameter aggregate count(Employee_GoalsID)Derived metric examples
If you want a variation on an existing metric, like a rate or an average, you can create a derived metric to reuse an existing metric's formula. Derived metrics are created from an existing metric. Depending on the type of derived metric you create, you will either adjust its settings or add a filter to an existing formula. For more information, see Derived metrics (optional).
Headcount Ratio
This example is a continuation of Headcount with Attribute. In this example, we'll create Headcount Ratio as a derived metric from Headcount with Attribute. We create derived metrics to organize related metrics and use features unique to derived metrics, like derived metric settings.
To create Headcount Ratio as a derived metric of Headcount with Attribute, do the following:
- In a project, on the navigation bar, navigate to Model > Metrics.
- Search for and select Headcount with Attribute.
- In Headcount with Attribute, navigate to Derived Metrics.
- Click Create Derived Metric.
- In Create derived metric, in Display name, type Headcount Ratio.
- In Derived metric type, select Rate.
- In Description, type The number of employees with a particular employee attribute at the end of the period.
- When finished, click Create.
Headcount Ratio is a rate calculation, which means it's calculated with a numerator and denominator. Because Headcount Ratio is derived from Headcount with Attribute, it inherits Headcount with Attribute's formula, which becomes Headcount Ratio's numerator.
To set the metric's denominator:
- In Headcount Ratio, navigate to Settings.
- In Denominator, select Headcount. This means that Headcount Ratio is calculated by dividing Headcount with Attribute by Headcount.
Additionally, in Settings, set the Data type to Percent.
Now that we understand a derived metric's numerator and denominator, let's go through our questions about what the metric calculates and how to execute the calculation.
- We want to answer the question "What percentage of employees in my organization are managers/women/retirement/... zone employees?"
- Headcount Ratio calculates data from the
Employeesubject. - Headcount Ratio calculates all records that are valid at the end of the selected time period. If an employee left the organization at some point during the selected time period, we don't want to include them in the ratio.
- Headcount Ratio selects active employees who have a user-selected attribute and divides them by the overall active employee population.
- Headcount Ratio is a Rate. We want to know the percentage of employees that have a specific attribute compared to the overall employee population.
- Headcount Ratio returns values as a percentage. We want a Percent data type so we can represent the proportion of employees with a specific attribute compared to the overall headcount.
-
Headcount Ratio is Non-additive because it can't be summed over any dimension, concept, or time; for example, Headcount Ratio (Employee Attribute: Manager) in January was 27% and in February it was 30%. We don't want to see a Headcount Ratio value of 57% for January and February when we select both months.
Tip: Ratio metrics are always non-additive!
We don't have to do anything to the metric formula for a derived metric. A derived metric inherits its parent's formula. In rate metrics like Headcount Ratio, the parent's formula becomes the numerator in the calculation, and you can select the denominator in the Settings tab, which we did earlier in this example.
And we're done! Preview the metric to validate that it works as expected, then publish the metric to production.
Tip: You can apply this example to any subject that you want a ratio of valid records with a selected attribute at the end of a selected time period. For example:
- Employee Exit Ratio: Create as a derived metric from Employee Exit Count with Attribute, then set the denominator to Employee Exit Count.
- Edited Goals Ratio: Create as a derived metric from Edited Goals with Attribute, then set the denominator to Total Active Goals.
Non-default time handling examples
Most metrics use the default time handling, where subject-based metrics use validUntil instant to query the state of the subject at the select time, and event-based metrics use occurredIn interval to query over the entire selected interval. In this section, we'll walk through metric examples that use alternative time handling functions, such as to calculate values over time or to find the last known state of a subject. For more information about time handling, see Metric formulas.
Average Headcount
This example highlights the time handling function forInstantsInInterval() and the aggregate function averageOverTime().
The function forInstantsInInterval() only works for subjects. It finds records in the specified time interval at the specified period boundaries to be used only with aggregation functions like sumOverTime and averageOverTime.
The aggregate function averageOverTime produces the average of a measure over a time interval, approximating the integral using the trapezoid rule on the instants specified by the time filter forInstantsInInterval or forIntervalsInInterval.
Note: The trapezoid rule approximates the region under a graph to calculate the area. In the context of Average Headcount, the trapezoid rule approximates a time integral using the formula's time filter.
Let's say that we're looking at a Trend visual for Headcount in January, February, March, and April 2023.
- January 2023: 962
- February 2023: 965
- March 2023: 969
- April 2023: 962
Average Headcount uses forInstantsInInterval() and averageOverTime to calculate the average headcount over a period of time. In this example, the time granularity is Month. Let's say we want to know the average headcount in February 2023.
We can calculate February 2023's average headcount by adding January 2023 + February 2023 and dividing by two (the number of months we included in the average): (962 + 965) / 2 = 963.5.
Next, let's walk through what the metric calculates and how to execute the calculation using VFL.
- We want to answer the question "On average, how many employees are in my organization?".
- Average Headcount calculates data from the
Employeesubject. - Average Headcount calculates all records that are valid at the end of the selected time period. If an employee left the organization at some point during the selected time period, we don't want to include that employee in the average. While this sounds like we could use
validUntil instant, we can actually useforInstantsInIntervaltime handling to allow the averaging of multiple months. - Average Headcount selects current employees. We don't want to average inactive employees. It calculates the average using the trapezoid rule on employee IDs for active employees. In Visier, current employees is a concept with the object name
isActiveEmployee. - Average Headcount is an
average over time. We want to know the average number of employees over a specific time period. With theaverageOverTimefunction, we have to specify an aggregation function. In this case, we'll usecount. In Visier, each employee record has a unique ID in theEmployeeIDproperty. - Average Headcount returns values in numbers. It's fine to have a decimal number when averaging our employee headcount, so Number is the data type.
- Average Headcount is Non-additive because it can't be summed over any dimension or concept. It is not additive over time because we don't want to add the Average Headcount from multiple time periods together; for example, Average Headcount in January was 156.5 and Average Headcount in February was 159.5. We don't want to see an Average Headcount value of 316 for January and February when we select both months.
Next, we can plug values into the standard formula syntax: on <subject//event> <time handling> filterBy(<filter condition>) aggregate <function>(<aggregation property>)
<subject//event>: Employee<time handling>: forInstantsInInterval(interval, month)<filter condition>: isActiveEmployee<function>: averageOverTime<aggregation property>: EmployeeID
Put together:
on Employee forInstantsInInterval(interval, month) filterBy(isActiveEmployee) aggregate averageOverTime(count(EmployeeID))Note: This formula uses one analytic object so we don't have to specify qualified names.
And we're done! Preview the metric to validate that it works as expected, then publish the metric to production. To validate, you can look at a Trend of Average Headcount compared to Headcount for a specific time period; for example, January and February 2023. For more information about comparing metrics, see Create a Metric Comparison.
Tip: You can apply this formula logic to any subject that you want an average over time of valid records at the end of a selected time period. For example:
on Employee forInstantsInInterval(interval(instant, back(months(6))), month) aggregate averageOverTime(count(EmployeeID))This formula averages the headcount going back six months in time.
Applicants Active During the Entire Period
This example highlights the time handling function lastKnownStateIn. The function is a time filter for data points that represent the last known state of a subject member in the time interval. In this example, lastKnownStateIn returns all applicants whose last known state was active for the entire selected time period. If an applicant is active from January to mid April, this metric includes the applicant when January, February, and March are selected, but wouldn't count the applicant for a selected time period of January, February, March, and April because the applicant was no longer active at some point in April.
First, let's decide what the metric calculates and how to execute the calculation.
- We want to answer the question "How many applicants were active for the duration of the period?".
- Applicants Active During the Entire Period calculates data from the
Applicantsubject. - Applicants Active During the Entire Period calculates all records that are valid for the full duration of the selected time period. If an applicant was not active at some point during the selected time period, we don't want to include them in the count. We can use
lastKnownStateIn intervaltime handling. - Applicants Active During the Entire Period selects active applicants. We don't want to count inactive applicants or applicants who became inactive during the period. In Visier, we can use the
isClosedApplicantconcept with the!operator to select not closed applicants. - Applicants Active During the Entire Period is a
count. We want to know the total number of unique applicants that were active during the entire period. In Visier, each employee record has a unique ID in theEmployeeIDproperty. - Applicants Active During the Entire Period returns values in integers. We want a whole number without any decimals when counting our Applicants Active During the Entire Period, so Integer is the data type.
- Applicants Active During the Entire Period is Additive because it can be summed over any dimension or concept, like summing the count of active applicants who are women. It is not additive over time because we don't want to add the Applicants Active During the Entire Period from multiple time periods together; for example, Applicants Active During the Entire Period in January was 300 and Applicants Active During the Entire Period in February was 305. We don't want to see an Applicants Active During the Entire Period value of 605 for January and February.
Next, we can plug values into the standard formula syntax: on <subject//event> <time handling> filterBy(<filter condition>) aggregate <function>(<aggregation property>)
<subject//event>: Applicant<time handling>: lastKnownStateIn interval<filter condition>: !isClosedApplicant<function>: count<aggregation property>: ApplicantID
Put together:
on Applicant lastKnownStateIn interval filterBy(!isClosedApplicant) aggregate count(ApplicantID)Note: This formula uses one analytic object so we don't have to specify qualified names.
And we're done! Preview the metric to validate that it works as expected, then publish the metric to production.
Tip: You can apply this formula logic to any object that you want a count of records that were valid for the entire period. For example:
on Applicant lastKnownStateIn filterBy(!isClosedApplicant && isInternalApplicant) aggregate count(ApplicantID) This formula counts the number of internal applicants who were active for the full duration of the selected time context.
on Employee_Cases lastKnownStateIn interval filterBy(isCaseOpen) aggregate count(Employee_CasesID) This formula counts the number of employee cases that were open for the full duration of the selected time context.
Headcount Active During Period
This example highlights the time handling function lastKnownStateByFilterIn that evaluates if a state was ever valid during the period.
First, let's decide what the metric calculates and how to execute the calculation.
- We want to answer the question "How many employees were active at any time during the period in my organization?".
- Headcount Active During Period calculates data from the
Employeesubject. - Headcount Active During Period calculates all records that are valid during the selected time period. We can use
lastKnownStateByFilterIntime handling with the parameters!isActiveEmployeeandinterval.Note:
lastKnownStateByFilterInlooks for inactive records (!isActiveEmployee) to check if the start of the inactive state is within the selected time period. If the metric only looked forisActiveEmployee, it wouldn't count records that changed from active to inactive during the period. The function usesintervalto scan through the selected time period to find any employee that was active at any time during the period. - Headcount Active During Period selects employees who were active at any time during the period. If an employee was active but left the organization during the period, the metric counts that employee as active during the period. In Visier, active employees is a concept with the object name
isActiveEmployee. - Headcount Active During Period is a
count. We want to know the total number of unique employees that were active at any time during the period. In Visier, each employee record has a unique ID in theEmployeeIDproperty. - Headcount Active During Period returns values in integers. We want a whole number without any decimals when counting our employee headcount active during the period, so Integer is the data type.
- Headcount Active During Period is Additive because it can be summed over any dimension or concept, like summing the headcount of active part-time employees who are women. It is not additive over time because we don't want to add the headcount from multiple time periods together; for example, Headcount Active During Period in January was 300 and Headcount Active During Period in February was 305. We don't want to see a Headcount Active During Period value of 605 for January and February when we select both months.
Next, we can plug values into the standard formula syntax: on <subject//event> <time handling> filterBy(<filter condition>) aggregate <function>(<aggregation property>)
<subject//event>: Employee<time handling>: lastKnownStateByFilterIn(<inactive filter>, <time filter>) where <inactive filter> is!isActiveEmployeeand <time filter> isinterval<function>: count<aggregation property>: EmployeeID
Put together:
on Employee lastKnownStateByFilterIn(!isActiveEmployee, interval) aggregate count(EmployeeID)Note: This formula uses one analytic object so we don't have to specify qualified names.
And we're done! Preview the metric to validate that it works as expected, then publish the metric to production.
Tip: You can apply this formula logic to any subject that you want a total count of valid records at some point during the selected time period. For example:
on Applicant lastKnownStateByFilterIn(isClosedApplicant, interval) aggregate count(Applicant.ApplicantID)This formula counts the number of applicants that were active at any time during the period.
Calculated property examples
Like metrics, calculated properties use a formula to calculate a value. A calculated property takes a value that comes directly from the data and creates a new value through a formula. You can use a calculated property in a concept or in a metric's formula to evaluate a subject member and calculate a new value. For more information, see Properties.
Exit After Selected Period
This example highlights the aggregate function exists(property, number). We'll then use the calculated property to create a selection concept that can then be used as a group by with other metrics, like Headcount. This combination of calculated property, selection concept, and metric give us the ability to select a time period to find out which group had the most exits after the selected time.
A calculated property evaluates each subject member individually to check if the member meets the formula criteria. In this example, the calculated property is created on the Employee subject and evaluates each employee to check if they have an exit event after the selected time period. For example, let's say you selected February 2023. The calculated property evaluates each employee to check if they exited after February 2023.
First, create the Exit After Selected Period calculated property on Employee. For more information, see Properties. You can leave Formula blank for now.
To write the calculated property formula, let's decide what the calculated property calculates.
- We want to answer the question "Which departments had the most exits after the selected time period?"
- Exit After Selected Period calculates data from the
Employee_Exitevent. - Exit After Selected Period evaluates active employees at a selected time period in the past, for example, February 2023, and then evaluates by looking forward in time to see if an employee exited the organization. To allow selecting a time period in the past, we can use the function
occurredIn interval(instant, latest). This time handling function means that it evaluates records that were valid at any time during the selected period (occurredIn interval) and look forward to the latest instant of data to evaluate the formula (instant, latest). - Exit After Selected Period does not select any records. It evaluates records to determine whether they meet the formula criteria. In this example, we will make a selection concept, Has Exit After Selected Period, that selects employees who are active during the selected period but have an exit event after the period (employees whose Exit After Selected Period property is
true). - Exit After Selected Period is an aggregation that evaluates whether an
Employee_Exitevent occurred on eachEmployee. To check if an event exists, we can use the functionexists(property, number). In this example, the property to check isEmployeeIDand the number is 1. This means that the calculation checks each employee ID to see if there is at least 1 exit event after the selected time. - Exit After Selected Period returns values as a Boolean. We want to know whether a member satisfies the formula criteria: if true, an employee has an exit event after the selected period. You can set the data type in the calculated property's Customize tab.
- Exit After Selected Period does not have an additivity setting because it's not a metric. It evaluates on individual employee records and returns a Boolean value for the employee.
Next, we can plug values into the standard formula syntax: on <subject//event> <time handling> filterBy(<filter condition>) aggregate <function>(<aggregation property>)
<subject//event>: Employee_Exit<time handling>: occurredIn interval(instant, latest)<filter condition>: isActiveEmployee<function>: exists<aggregation property>: (EmployeeID, 1)
Put together:
on Employee_Exit occurredIn interval(instant, latest) aggregate exists(EmployeeID, 1)Tip: You can use exists(property, number) in any formula that you want to evaluate whether a specific property has a certain number of values. For example:
on Applicant via Requisition validUntil instant aggregate exists(Applicant.ApplicantID, 2))This formula evaluates each requisition to check if it has at least 2 applicant IDs associated with it.
To finish this example, let's talk about how you can use the calculated property.
- Create a calculated selection concept with the display name Has Exit After Selected Period. In the formula, type
Employee.Exit_After_Selected_Period. This means that the concept will select any employee record whose Exit After Selected Period property istrue. For more information about creating concepts, see Create a Selection Concept. - In the solution experience, in Explore, set the visual title to Breakdown of Headcount by Organization.
- In the Time picker, select a time period in the past.
- In the Filter picker, select Has Exit After Selected Period.
Result: You can see the number of employees that exited the organization after the selected time period for each department. For example, if Marketing in February 2023 is 138, that means that 138 employees in Marketing exited the organization since February 2023. In the Info panel, in the Insights tab, click View details to see which employees exited after the selected period.
Tenure
This calculated property example highlights the function monthsBetween(). After writing the formula, we'll use the calculated property to create a metric that calculates the average tenure of employees in years. In this example, we create Tenure as a calculated property so that we can store Tenure as a property on the Employee subject. If we only wrote tenure into a metric formula without a calculated property, we couldn't see an employee's tenure in the Detailed View visual.
A calculated property evaluates each subject member individually to check if the member meets the formula criteria. In this example, the calculated property is created on the Employee subject and evaluates each employee to calculate their tenure in months (so that we can show the monthsBetween() function).
First, create the Tenure calculated property on Employee. For more information, see Properties. You can leave Formula blank for now.
To write the calculated property formula, let's decide what the calculated property calculates.
- We want to answer the question "How long has an employee worked at the organization?".
- Tenure calculates data from the
Employeesubject. However, it's created as a property on theEmployeesubject, so we don't need to include theon Employeestatement in the formula. - Tenure doesn't have a time handling function because it's calculating the time between two set dates in the employee data.
- Tenure doesn't select any records. It evaluates employee records to calculate the time between the current date and the employee's start data at the organization.
- Tenure is a
months betweencalculation. We want to know number of months between an employee's start date and the current date in the Gregorian calendar. In Visier, an employee's start date is a property with the object nameStart_Date. To get the current date in the Gregorian calendar, use the functionseffectiveDateandgregorian. - Tenure returns values in Months. You can set the data type in the calculated property's Customize tab.
- Tenure does not have an additivity setting because it's not a metric. It evaluates on individual employee records and returns a value in months for the employee.
For the Tenure calculated property, we will use the monthsBetween syntax instead of the standard metric syntax: monthsBetween(property, property, number). For more information, see Visier Formula Language (VFL).
property: Start_Dateproperty: effectiveDatenumber: gregorian
Put together:
monthsBetween(Start_Date, effectiveDate, gregorian)Tip: You can use monthsBetween(property, property, number) in any formula that you want to calculate the number of months between two time instants based on the Gregorian calendar. For example:
This formula evaluates each employee to calculate the number of months between an employee's birth date and the effective date in the Gregorian calendar.
To finish this example, let's talk about how you can use the calculated property.
- Create a metric with the display name Tenure. In the formula, type
on Employee filterBy(isActiveEmployee) aggregate average(Tenure/12). This means that the metric calculates the average tenure of current employees at the end of the selected period and divides that value by 12. Because the Tenure calculated property is calculated in months, we divide the metric value by 12 to get a value in years. - In the metric settings, set the Data type to Years and the Additivity type to Non-additive. Tenure is non-additive because it can't be summed over any concept, dimension, or time; for example, Tenure in January was 5.4 years and Tenure in February was 6.2 years. We don't want to see a Tenure value of 11.6 years for January and February when we select both months.
- In the solution experience, in Explore, set the visual title to Breakdown of Tenure by Organization.
- In the Time picker, select a time period that has employee data.
Result: You can see the average number of years that employees have worked at the organization as of the selected time period for each department. For example, if Marketing in February 2023 is 1.3, that means active Marketing employees in February 2023 have worked at the organization for an average of 1.3 years. In the Info panel, in the Insights tab, click View details to see the Tenure for each Marketing employee, as long as Tenure is configured to appear in the Detailed View visual. For instructions on how to add properties to Detailed View, see Configure View Details.
Time in Job Family
This example highlights the function currentStateStart(). The currentStateStart() function evaluates values to understand the period length that the value has been in that state. It evaluates on text, number, and Boolean data types.
Expanding on what we just learned about monthsBetween(), we will use monthsBetween() and currentStateStart() to evaluate each employee individually to understand the length of time the employee has been in their current job family.
We'll then use the calculated property to create a metric that calculates the average time in job family of all employees in months. In this example, we create Time in Job Family as a calculated property so that we can store Time in Job Family as a property on the Employee subject. If we only wrote time in job family into a metric formula without a calculated property, we couldn't see an individual employee's time in job family in the Detailed View visual.
First, let's decide what the calculated concept calculates and how to execute the calculation.
- We want to answer the question "How long has the employee been in their current job family?".
- Time in Job Family calculates data from the
Employeesubject. However, it's created as a property on theEmployeesubject, so we don't need to include theon Employeestatement in the formula. - Time in Job Family doesn't have a time handling function because it's calculating the time between two set dates in the employee data.
- Time in Job Family selects the
Job_Familyrecord. - Time in Job Family is a months between calculation. We want to know number of months between an employee's start date and the effective date in the Gregorian calendar. Additionally, it's a current state start calculation (
currentStateStart()). We want to take the employee's current state in a particular property (in this example, Job Family) and calculate the months between the start of that state and the effective date in the Gregorian calendar to find how long the employee has been in that state. To get the current date in the Gregorian calendar, use the functionseffectiveDateandgregorian. - Time in Job Family returns values in Months. You can set the data type in the calculated property's Customize tab.
- Time in Job Family does not have an additivity setting because it's not a metric. It evaluates on individual employee records and returns a value in months for the employee.
For the Time in Job Family calculated property, we will use the monthsBetween syntax instead of the standard metric syntax: monthsBetween(property, property, number). For more information, see Visier Formula Language (VFL).
property: currentStateStart(property)property: Job_Family
property: effectiveDatenumber: gregorian
All together:
monthsBetween(currentStateStart(Job_Family), effectiveDate, gregorian)Tip: You can use currentStateStart(property) in any formula that you want to calculate the time instant when the property changed to its current value. For example:
on Applicant aggregate(average(daysBetween(currentStateStart(Applicant.Stage), effectiveDate)))This formula calculates the average number of days applicants spend in the current stage.
To finish this example, let's talk about how you can use the calculated property.
- Create a metric with the display name Time in Job Family. In the formula, type
on Employee filterBy(isActiveEmployee) aggregate average(Time_in_Job_Family). This means that the metric calculates the average time that current employees have spent in their current job family at the end of the selected period. - In the metric settings, set the Data type to Months and the Additivity type to Non-additive. Tenure is non-additive because it can't be summed over any concept, dimension, or time; for example, Time in Job Family in January was 5.4 months and Time in Job Family in February was 6.2 months. We don't want to see a Time in Job Family value of 11.6 months for January and February when we select both months.
- In the solution experience, in Explore, set the visual title to Breakdown of Time in Job Family by Organization.
- In the Time picker, select a time period that has employee data.
Result: You can see the average number of months that employees have spent in their current job family as of the selected time period for each department. For example, if Marketing in February 2023 is 1.3, that means active Marketing employees in February 2023 have been in their current job families for an average of 1.3 months. In the Info panel, in the Insights tab, click View details to see the Time in Job Family for each Marketing employee, as long as Time in Job Family is configured to appear in the Detailed View visual. For instructions on how to add properties to Detailed View, see Configure View Details.
Overtime to Regular Hours Worked Ratio
In this example, we'll use two calculated properties to calculate a ratio. There's several layers to this calculated property, starting with two selection concepts that are then used in two calculated properties.
First, let's figure out what we need to know before we can calculate the percentage of overtime hours that your employees work compared to regular hours. We must know each employee's regular worked hours and overtime hours. To know that, the data that you send to Visier must have a column that identifies the type of work hours your employees completed; for example, a column called Hours Recorded with values such as OT, REG, and PTO.
To give the data values meaning in Visier, we can use selection concepts to identify certain values as Regular Hours or Overtime Hours. In this example, we'll have two selection concepts, as follows:
- Regular Hours (object name:
isRegularHours): Selects the REG value. - Overtime Hours (object name:
isOvertimeHours): Selects the OT value.
We can use these selection concepts in calculated property formulas to calculate the amount of regular hours and overtime hours that each employee works. In this example, we'll have two calculated properties created on the Employee subject, as follows:
- Regular Hours (object name:
Regular_Hours): Calculates the regular hours that an employee worked. The formula ison Hours occurredIn periodOf(instant) filterBy isRegularHours aggregate sum(Hours.Hours). In the Customize tab, the data type is Hours. - Overtime Hours (object name:
Overtime_Hours): Calculates the overtime hours that an employee worked. The formula ison Hours occurredIn periodOf(instant) filterBy isOvertimeHours aggregate sum(Hours.Hours). In the Customize tab, the data type is Hours.
Now that we're able to calculate an employee's regular worked hours and overtime worked hours, we can calculate the ratio of overtime hours to regular hours. Typically, a ratio is one value divided by a different value. In this example, we want to divide overtime hours by the number of regular hours.
Next, let's decide how to calculate the calculated property and how to execute the calculation.
- We want to answer the question "What is the ratio for each employee's overtime to regular work hours?".
- Overtime to Regular Worked Hours Ratio calculates a value for each employee, so it is created on the
Employeesubject. - Overtime to Regular Worked Hours Ratio doesn't have a time handling function because it calculates a ratio.
- Overtime to Regular Worked Hours Ratio is a Rate that uses the calculated properties Overtime Hours and Worked Hours. We want to know the percentage of overtime hours an employee has worked compared to regular hours.
- Overtime to Regular Worked Hours Ratio returns values in Percent. You can set the data type in the calculated property's Customize tab.
- Overtime to Regular Worked Hours Ratio does not have an additivity setting because it's not a metric. It evaluates on individual employee records and returns a value in percent for the employee.
For the Overtime to Regular Worked Hours Ratio calculated property, we will divide two properties instead of using the standard metric syntax.
(Employee.Overtime_Hours) / (Employee.Worked_Hours)To finish this example, let's talk about how you can use the calculated property.
- Create a metric with the display name Average Employee Overtime to Regular Worked Hours Ratio. In the formula, type
on Employee filterBy(isActiveEmployee) aggregate average(overtime_to_regular_hours_ratio). This means that the metric calculates the average percentage of hours that current employees worked overtime compared to regular hours at the end of the selected period. - In the metric settings, set the Data type to Percent and the Additivity type to Non-additive. Average Employee Overtime to Regular Worked Hours Ratio is non-additive because it can't be summed over any concept, dimension, or time; for example, Average Employee Overtime to Regular Worked Hours Ratio in January was 25% and Average Employee Overtime to Regular Worked Hours Ratio in February was 13%. We don't want to see a Average Employee Overtime to Regular Worked Hours Ratio value of 38% for January and February when we select both months.
- In the solution experience, in Explore, set the visual title to Breakdown of Average Employee Overtime to Regular Worked Hours Ratio by Organization.
- In the Time picker, select a time period that has employee data.
Result: You can see the average percentage that employees worked overtime compared to regular hours as of the selected time period for each department. For example, if Marketing in February 2023 is 20%, that means active Marketing employees in February 2023 worked, on average, 20% more than their regular hours. In the Info panel, in the Insights tab, click View details to see the Overtime to Regular Worked Hours Ratio for each Marketing employee, as long as Overtime to Regular Worked Hours Ratio is configured to appear in the Detailed View visual. For instructions on how to add properties to Detailed View, see Configure View Details.
Analytic object reference examples
The analytic model can consist of multiple analytic objects. In some cases, it may be useful to connect the information stored in one subject with another subject or event. Subject references are special properties that establish the relationship between subjects and events in the analytic model. This allows members of different subjects to link to one another through a forward or reverse reference, providing an additional layer of detail for the relationship between objects. For example, you may want to look at Applicant data when analyzing employees to understand where your top talent was sourced. In this example, the Employee object references the Applicant object to connect an Employee's data to its data as an Applicant, if available. For more information, see References. In a metric formula, you can use the reference relationship between analytic objects to access data from both objects in a single metric using the via function.
Average Direct Span of Control
This example shows how to join data from two analytic objects using references. Additionally, this example highlights the function spanOfControl(). The function takes in a query, a hierarchy, and the span of control calculated property. spanOfControl() has the following syntax:
spanOfControl(query, hierarchy, property)First, we must create a calculated property called Direct Span of Control that evaluates the number of direct reports an employee has. To accomplish that, Direct Span of Control (object name: Span_Of_Control) has the following formula:
on Employee via Direct_Manager to Employee filterBy isActiveEmployee aggregate count(EmployeeID)- We want to answer the question "How many direct reports does a manager have?"
- Direct Span of Control calculates data from the
Employeesubject, including an employee's Direct Manager data (via Direct_Manager to Employee). - Direct Span of Control evaluates active employees that are valid at the end of the selected time period. If an employee left the organization at some point during the selected time period, we don't want to include them in the count. We can use
validUntil instanttime handling. - Direct Span of Control selects current employees. We don't want to count inactive employees in the span of control for a manager. In Visier, current employees is a concept with the object name
isActiveEmployee. - Direct Span of Control is a
count. We want to know the number of direct reports an employee has. In Visier, each employee record has a unique ID in theEmployeeIDproperty. - Direct Span of Control returns values in integers. We want a whole number without any decimals when counting a manager's span of control, so Integer is the data type. You can set the data type in the calculated property's Customize tab.
- Direct Span of Control does not have an additivity setting because it's not a metric. It evaluates on individual employee records and returns an integer value for the employee.
Next, let's decide what the Average Direct Span of Control metric calculates and how to execute the calculation.
- We want to answer the question "What is the average number of direct reports per manager at the end of the period?"
- Average Direct Span of Control calculates data from the
Employeesubject. - Average Direct Span of Control calculates all records that are valid at the end of the selected time period. If an employee left the organization at some point during the selected time period, we don't want to include them in the average. We can use
validUntil instanttime handling. - Average Direct Span of Control selects current employees. We don't want to average inactive employees. In Visier, current employees is a concept with the object name
isActiveEmployee. - Average Direct Span of Control is an
average. We want to know the average number of direct reports per manager in theSupervisory_Hierarchy. - Average Direct Span of Control returns values in numbers. It's fine to have decimal number when averaging our number of direct reports per manager, so Number is the data type.
- Average Direct Span of Control is Non-additive because it can't be summed over dimensions, concepts, or time. We don't want to add the Average Direct Span of Control from multiple time periods together; for example, Average Direct Span of Control in January was 3.50 and Average Direct Span of Control in February was 4.50. We don't want to see an Average Direct Span of Control value of 8 for January and February when we select both months.
Next, we can plug values into the standard formula syntax: on <subject//event> <time handling> filterBy(<filter condition>) aggregate <function>(<aggregation property>)
<subject//event>: Employee<time handling>: validUntil instant<filter condition>: isActiveEmployee<function>: average<aggregation property>: Span_Of_Control
Put together:
spanOfControl(on Employee filterBy(isActiveEmployee) aggregate average(Span_Of_Control), Supervisory_Hierarchy, "Supervisory_Head")Note:
- In this example, we're using the default time handling for a subject, so we'll omit it from the final formula.
- This formula uses one analytic object so we don't have to specify qualified names.
And we're done! Preview the metric to validate that it works as expected, then publish the metric to production.
Tip: You can apply this formula logic and add additional filters to get the average span of control for a certain manager population at the end of a selected time period. For example:
spanOfControl(on Employee filterBy(isActiveEmployee && isFemale) aggregate average(Span_Of_Control), Supervisory_Hierarchy, "Supervisory_Head") This formula calculates the average span of control for female managers.
spanOfControl(on Employee filterBy(isActiveEmployee && isUSOnly) aggregate average(Span_Of_Control), Supervisory_Hierarchy, "Supervisory_Head")This formula calculates the average span of control for US managers.
Open Requisition Count
This example shows how to join data from two analytic objects using references. In this example, we want to count the number of open requisitions that have more than 5 applicants. This requires data from two subjects: Requisition and Applicant.
To accomplish this in the metric formula, we use a nested query to create an intermediate calculated property called NumberOfApplicantsForRequisition. In the nested query, the formula is on Applicant and uses the via function to call Applicant's reference, Requisition. This relies on a reference relationship between Applicant and Requisition. For more information about nested queries, see Nested query formula examples.
First, let's decide what the metric calculates and how to execute the calculation.
- We want to answer the question "How many open requisitions have 5 or more applicants at the end of the period?".
- Open Requisition Count calculates data from the
Requisitionsubject. - Open Requisition Count calculates all records that are open at the end of the selected time period. If a requisition was closed at the end of the selected time period, we don't want to include it in the count. We can use
validUntil instanttime handling. - Open Requisition Count selects open requisitions. We don't want to count closed requisitions. In Visier, open requisition is a concept with the object name
isOpenRequisition. It also selects the intermediate calculated propertyNumberOfApplicantsForRequisitionwith the> 5operator to only select requisitions with more than 5 applicants. - Open Requisition Count is a
count. We want to know the total number of unique requisitions that have 5 or more applicants. In Visier, each requisition has a unique ID in theRequisitionIDproperty. - Open Requisition Count returns values in integers. We want a whole number without any decimals when counting open requisitions, so Integer is the data type.
- Open Requisition Count is Additive because it can be summed over any dimension or concept, like summing the count of open requisitions for full-time regular positions. It is not additive over time because we don't want to add the open requisition count from multiple time periods together; for example, Open Requisition Count in January was 300 and Open Requisition Count in February was 305. We don't want to see an Open Requisition Count value of 605 for January and February when we select both months.
Next, we can plug values into the standard formula syntax: on <subject//event> <time handling> filterBy(<filter condition>) aggregate <function>(<aggregation property>)
<subject//event>: Requisition<time handling>: validUntil instant<filter condition>: NumberOfApplicantsForRequisition > 5 && isActiveEmployee<function>: count<aggregation property>: RequisitionID
Put together:
NumberOfApplicantsForRequisition := property(on Applicant via Requisition validUntil instant aggregate count(Applicant.ApplicantID))
on Requisition filterBy(NumberOfApplicantsForRequisition > 5 && isOpenRequisition) aggregate count(RequisitionID)Note:
- In this example, we're using the default time handling for a subject, so we'll omit it from the final formula.
- This formula uses one analytic object so we don't have to specify qualified names.
And we're done! Preview the metric to validate that it works as expected, then publish the metric to production.
Tip: You can apply this formula logic to any event that you want a total count of valid records for data from multiple subjects, as long as those subjects reference each other in Visier. For example:
interviewCount := property(on Interview via Interviewer occurredIn periodOf(instant) aggregate count(applicantID))
on Employee filterBy interviewCount > 0 aggregate count(EmployeeID)This formula counts the number of employees who interviewed one or more applicants.
Nested query formula examples
A nested query defines a property whose values come from aggregating other records in a different table by going through the reference between the two tables. A nested query can be assigned to a local variable using the := function within a formula. Variables only exist in the formula that they're written in; you cannot reference a nested query's variable in a different object's formula. For more information about assigning variables, see Visier Formula Language (VFL).
Every query, including nested queries, has exactly one time filter. Nested queries can only access time instants, like the EffectiveDate of the record from the outer query, and not time intervals like occuredIn(interval) or lastKnownStateIn(interval). This ensures fast execution of nested queries. If a nested query requires access to the outer query's interval, alternative solutions are available, which won't always match the original interval.
One approach is to use the periodOf(instant) function within the nested query. This function reconstructs a time period based on the outer query instant, period type, and count of the outer query. However, this has some limitations. The issue arises when the outer query's interval spans multiple underlying periods, like a multi-month query, and the query instant falls before the final period. Because the periodOf(instant) function only uses the instant and the full period length to define a new interval, it generates an interval that ends on the period containing the instant. This doesn't recreate the original, multi-period outer query interval.
For example, consider an exit count metric grouped by a Has Promotion concept, which uses a nested query with periodOf(instant) to check for a promotion event. Selecting an interval containing three periods will run into the above limitation. The metric calculates who are the employees who exited and had a promotion in the three month period before their exit. In other words, it won't be calculating who are the employees who exited and had a promotion in the selected period. If this is not the desired outcome, you can:
- Limit analysis to a single period by selecting only one time period in the query, like a single month or quarter. In this case using the month(instant) function.
- Create a calculated property that explicitly defines the interval to be used for both the outer and nested logic. While this helps align the period boundaries, it requires additional configuration and won't dynamically adapt to user-selected intervals. For more information see Calculated properties.
- Apply event filters directly to outer the query. This avoids the nested query rebuilding the interval, ensuring both events are evaluated within the same selection window. For more information, see Filters.
Future Work Anniversary
This example highlights using a nested query in a metric formula.
In this example, we use := to assign a Future_Work_Anniversary_Date intermediary calculated property that evaluates each employee's start date. The user can dynamically shift the start date by a specific year to find anyone who has a work anniversary coming up in the future.
To accomplish this, we'll define Future_Work_Anniversary_Date using:
- The
shift()function to shift the start date forward. - A metric parameter called
Anniversary_Length_Parameterto dynamically assign the number of years to shift by. In this example, after creating the Future Work Anniversary metric, we can navigate to the Parameters tab and create a numeric parameter calledAnniversary_Length_Parameter. For more information, see Parameters (optional).
Then, in the metric's outer query, we can use Future_Work_Anniversary_Date in the time handling statement.
First, let's decide what the metric calculates and how to execute the calculation.
- We want to answer the question "Which employees have their 5 year work anniversary next year?".
- Future Work Anniversary calculates data from the
Employeesubject. - Future Work Anniversary calculates all records that are valid during the selected time period. If an employee left the organization, we don't want to count future work anniversaries for those employees. We can use
occurredIn intervaltime handling with theFuture_Work_Anniversaryintermediary calculated property to find employees in the time period with a work anniversary. - Future Work Anniversary selects current employees. We don't want to count anniversaries for inactive employees. In Visier, current employees is a concept with the object name
isActiveEmployee. - Future Work Anniversary is a
count. We want to know the total number of upcoming work anniversaries for employees. In Visier, each employee record has a unique ID in theEmployeeIDproperty. - Future Work Anniversary returns values in integers. We want a whole number without any decimals when counting upcoming work anniversaries, so Integer is the data type.
-
Future Work Anniversary is Additive over time because it can be summed over time, dimensions, and concepts. For example, we can add the future work anniversaries from multiple time periods together; for example, Future Work Anniversary filtered by Women in January is 25 and Future Work Anniversary filtered by Women in February is 15. We want to see a Future Work Anniversary filtered by Women value of 40 for January and February when we select both months.
Next, we can plug values into the standard formula syntax: on <subject//event> <time handling> filterBy(<filter condition>) aggregate <function>(<aggregation property>)
<subject//event>: Employee<time handling>: occurredIn(interval, <date attribute>), where <date attribute> is theFuture_Work_Anniversary_Dateintermediary calculated property<filter condition>: isActiveEmployee<function>: count<aggregation property>: EmployeeID
Put together:
Future_Work_Anniversary_Date := property(on Employee validUntil instant aggregate(max(shift(Start_Date, years(Anniversary_Length_Parameter), gregorian))))
on Employee occurredIn(interval, Future_Work_Anniversary_Date) filterBy(isActiveEmployee) aggregate count(EmployeeID)Note:
- In this example, we used a numeric parameter as the time handling function. This allows users to specify which milestone anniversary is approaching (such as 5 or 10 year anniversaries).
- This formula uses one analytic object so we don't have to specify qualified names.
And we're done! Preview the metric to validate that it works as expected, then publish the metric to production.
Tip: You can apply this formula logic to any subject that you want a total count of valid records in the future. For example:
expectedExitDay := property(on Future_Employee_Exit occurredIn(interval(earliest, latest)) aggregate(max(Expected_Termination_Date)))
on Employee occurredIn(interval, expectedExitDay) aggregate count(EmployeeID)This formula counts the number of expected employee exits during a future time period.
Manager Instability Count
This metric formula shows how to use a nested query in a calculated property. In this example, we use := to assign a managerChangeCount intermediary calculated property.
In addition to :=, this example shows the functions previousChanges() and hasChanged(). The previousChanges() function complements hasChanged() by evaluating whether a previous data record had a change. In this example, we use previousChanges() to specify that we want to check changes on the Employee subject and we use hasChanged() to specify that we're looking for changes to the Direct Manager ID property.
First let's decide what the metric calculated and how to execute the calculation.
- We want to answer the question "How many employees had at least one manager change during the period?".
- Manager Instability Count calculates data from the
Employeesubject. - Manager Instability Count calculates all records that occurred during the time period. If an employee's direct manager ID changed in December compared to the previous ID, the employee is counted once for December. We can use
validUntil instanttime handling. - Manager Instability Count selects employees who had at least one manager change. We don't want to count employees who had the same manager during the period. We can filter by the
managerChangeCountwith the> 0operator to select all employees whose manager change count is more than 0. - Manager Instability Count is a
count. We want to know the total number of unique employees who had at least one manager change. In Visier, each employee record has a unique ID in theEmployeeIDproperty. - Manager Instability Count returns values in integers. We want a whole number without any decimals when counting our employee manager instability, so Integer is the data type.
- Manager Instability Count is Additive because it can be summed over any dimension or concept, like summing the manager instability of part-time employees who are women. It is not additive over time because we don’t want to add the Manager Instability Count from multiple time periods together; for example, Manager Instability Count in January was 24 and Manager Instability Count in February was 16. We don't want to see a Manager Instability Count of 40 for January and February when we select both months.
Next, we can plug values into the standard formula syntax: on <subject//event> <time handling> filterBy(<filter condition>) aggregate <function>(<aggregation property>)
<subject//event>: Employee<time handling>: validUntil instant<filter condition>: managerChangeCount<function>: count<aggregation property>: EmployeeID
Put together:
managerChangeCount := property(on previousChanges(Employee) occurredIn periodOf(instant) filterBy (hasChanged(Direct_ManagerID) && isActiveEmployee && !conception) aggregate count(EmployeeID))
on Employee filterBy(managerChangeCount > 0) aggregate count(EmployeeID)Note:
- In this example, we're using the default time handling for a subject, so we'll omit it from the final formula.
- This formula uses one analytic object so we don't have to specify qualified names.
- In this example,
managerChangeCountis a filter condition that looks at each active employee who has at least one manager change during the period. If an employee had 2 manager changes in the period, the metric counts that employee once. - The nested query filters by
!conceptionso that the calculation doesn't include conception events. This excludes employees whose direct manager ID changed from Unknown to a specific ID because we only want to count employees who changed from one direct manager to a different direct manager.
And we're done! Preview the metric to validate that it works as expected, then publish the metric to production.
Tip: You can apply this formula logic to any subject where you are comparing a previous state and counting the number of occurrences based on your formula. For example:
on previousChanges(Requisition) filterBy(isClosedFilledRequisition && (previous(not isClosedFilledRequisition) || conception)) aggregate count(Requisition.RequisitionID)This formula counts the number of requisitions that changed from a different status to Closed Filled in the period.
Employees with the Same Surname as a Candidate Count
This example highlights the functions values() and include().
values(): Produces a list of values computed by applying an expression to all records found by the query with the syntaxvalues<expression>. In this example, produces a list of candidate surnames.include(): Creates a filter for data points that have a property value in the list of values from a query result with the syntaxinclude(Property, QueryValues). In this example, creates a filter for employees who have the same surname as a candidate.
In this formula example, we'll write a nested query to create a calculated property that uses the values() function to produce a list of candidate surnames. The calculated property is then used as a filter in the formula's outer query, allowing us to match candidate surnames to employee surnames.
To write the Surname calculated property formula, we must decide what to calculate.
- We want to answer the question "What surnames do candidates have?"
- Surname calculates data from the
Candidatesubject. - Surname evaluates candidates that are active at the end of the period. We do not want to include candidates who became inactive during the period. We can use
validUntil instanttime handling. - Surname selects active candidates. In Visier, active candidates is a concept with the object name
isActiveCandidate. - Surnames evaluates each candidate to return a list of their surnames. We want to retrieve a list of candidate surnames so that we can use it as a filter. We can use the
valuesfunction with theCandidatepropertyLast_Name. - Surname does not have a data type because it is a nested query.
- Surname does not have an additivity setting because it's not a metric.
Next, we can plug values into the standard calculated property nested query syntax: propertyName := on <subject//event> <time handling> filterBy(<filter condition> values <expression>)
<propertyName>: Surname<subject//event>: Candidate<time handling>: validUntil instant<filter condition>: isActiveCandidate<expression>: Last_Name
Put together:
Surname := on Candidate filterBy Candidate.isActiveCandidate values Candidate.Last_NameNext, we need to decide how to calculate the outer query.
- We want to answer the question "How many current employees have the same surname as a current candidate?"
- Employees with the Same Surname as a Candidate Count calculates data from the
Employeesubject. - Employees with the Same Surname as a Candidate Count calculates all records that are valid at the end of the selected time period. If an employee left the organization at some point during the selected time period, we don't want to include them in the count. We can use
validUntil instanttime handling. - Employees with the Same Surname as a Candidate Count selects current employees who have the same surname as a candidate. We don't want to count inactive employees. In Visier, current employees is a concept with the object name
isActiveEmployee. To get employee last names that match candidate last names, we can use theincludefunction with the Surname intermediary calculated property and theEmployeepropertyLast_Name. - Employees with the Same Surname as a Candidate Count is a
count. We want to count the number of employees who have the same surname as a candidate. In Visier, each employee record has a unique ID in theEmployeeIDproperty. - Employees with the Same Surname as a Candidate Count returns values in integers. We want a whole number without any decimals when counting employees that have the same surname as a candidate, so Integer is the data type.
- Employees with the Same Surname as a Candidate Count is Additive because it can be summed over any dimension or concept, like summing the count of part-time employees who are women that have the same surnames as a candidate. It is not additive over time because we don't want to add the Employees with the Same Surname as a Candidate Count from multiple time periods together; for example, Employees with the Same Surname as a Candidate Count in January was 3 and Employees with the Same Surname as a Candidate Count in February was 4. We don't want to see an Employees with the Same Surname as a Candidate Count value of 7 for January and February when we select both months.
Next, we can plug values into the standard formula syntax: on <subject//event> <time handling> filterBy(<filter condition>) aggregate <function>(<aggregation property>)
<subject//event>: Employee<time handling>: validUntil instant<filter condition>: include(Last_Name, Surname) && isActiveEmployee<function>: count<aggregation property>: EmployeeID
Put together:
on Employee filterBy (include(Employee.Last_Name, Surname) && Employee.isActiveEmployee) aggregate count(Employee.EmployeeID)Then, we can combine the nested query and outer query to form the complete metric formula:
Surname := on Candidate filterBy Candidate.isActiveCandidate values Candidate.Last_Name
on Employee filterBy (include(Employee.Last_Name, Surname) && Employee.isActiveEmployee) aggregate count(Employee.EmployeeID)Note: In this example, we're using the default time handling for a subject, so we'll omit it from the final formula.
And we're done! Preview the metric to validate that it works as expected, then publish the metric to production.
Tip: You can apply this formula logic to any subject that you want to filter values against a returned list of values by a nested query. For example:
FirstName := on Candidate filterBy Candidate.isActiveCandidate values Candidate.First_Name
on Employee filterBy (include(Employee.First_Name, FirstName) && Employee.isActiveEmployee) aggregate count(Employee.EmployeeID)
This formula counts the number of active employees who have the same first name as an active candidate.