View and Present an Analysis
Learn how to view and present your analysis in full screen.
View an analysis
Tip: Watch this video to learn how to interact with the visuals in an analysis.
-
On the navigation bar, click Analyses
 .
. - In the Analyses list, select the analysis you want to view.
- Optional: Change the analysis context by adding filters or changing the time period for all charts in the analysis. For more information on how to change the analysis context when viewing an analysis, see The Analysis Context.
- Optional: If the analysis is dynamic, change the parameter values by clicking Parameters in the upper-right corner of the screen. For more information about parameterization in dynamic analyses, see Create a Dynamic Template.
- Optional: Click on a chart to see it in full screen and conduct ad hoc analysis.
Scroll through the analysis like you're reading an online journal. To see an outline of the analysis, collapse the content under each header by clicking the Expand/Collapse button ![]() in the upper-right corner of the screen.
in the upper-right corner of the screen.
Tip: Not seeing the information you expected in an analysis? For more information about troubleshooting an analysis, see Debug an Analysis.
Present an analysis
Tip: Watch this video to learn how to present an analysis.
You can present your analysis to stakeholders in full screen. When you enter a presentation view, your analysis is converted into a slideshow. Each individual slide corresponds to a Header (business question) and a row in the analysis layout. All cards within a row will be displayed on one slide. The charts are interactive, so hover over data points to get more information on chart items and metric values. You can also conduct ad hoc analysis by clicking a chart. This allows you to answer any questions that may come up during your presentation.
Present an analysis in full screen
- Open the analysis you want to present in the Guidebooks or Analyses room.
- Click the Present analysis button
 in the upper-right corner of the analysis.
Toggle full screen
When presenting, you can exit full screen to present your analysis in your browser window.
- Hover over the bottom of your screen or browser window and do one of the following:
- Click the Exit full screen button
 to present your analysis in your browser window. The presentation resizes to fit the browser window.
 - Click the Full screen button
 to present your analysis in full screen. The presentation expands to fill the entire screen.
- Click the Exit full screen button
Go to the next slide
| Mouse actions | Keyboard actions |
|---|---|
|
Press the Down Arrow or Right Arrow key. |
Go to the previous slide
| Mouse actions | Keyboard actions |
|---|---|
|
Press the Up Arrow or Left Arrow key. |
Go to a specific slide
- Hover over the bottom of your screen or browser window and click the slide title.

- Select the slide that you want to go.
Stop presenting
| Mouse actions | Keyboard actions |
|---|---|
|
Press the Esc key. |
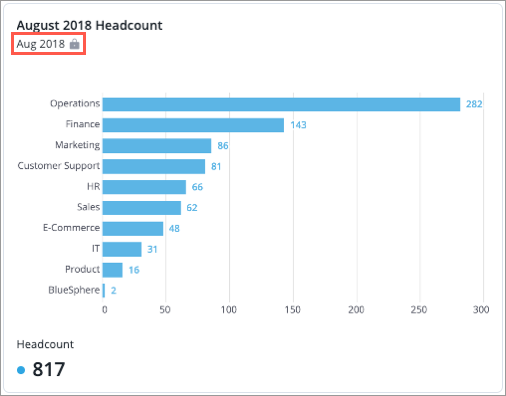
Note: Data in charts with a fixed time setting will not change when the time period or granularity of the analysis is changed, even if the analysis has the time granularity synchronized. Fixed charts will be indicated by a lock icon ![]() beside the time period. For more information, see The Time Context.
beside the time period. For more information, see The Time Context.