
Create a Vee Board
Turn your analysis into an AI-augmented insight board.
Access requirements
Permission with these capabilities: Enable AI Explanation and Vee Boards
Reach out to your administrator for access.
Prerequisites: Your organization must opt in to AI features. In the global workspace, click Settings > AI Features.
Vee Boards are analyses focused on specific issues with AI explanations enabled. For more information, see Vee Boards.
-
On the navigation bar, click Analyses
 .
. - In the upper-right corner of the Analyses room, click New analysis.
Result: The Analysis Editor appears. For more information, see Create an Analysis.
- Turn on AI explanations for the analysis:
- In the Analysis Editor, click the Analysis settings
 button.
 - In the Analysis settings dialog, turn on the AI explanations toggle.
- Click Apply.
- In the Analysis Editor, click the Analysis settings
-
Use the following analysis settings to achieve the Vee Board design and layout:
- Layout mode: Dashboard layout
- Default view mode: Collapsed
- Edit preview appearance: Visualization
-
Add content to the analysis.
Note: The maximum number of visualizations you can include is 25.
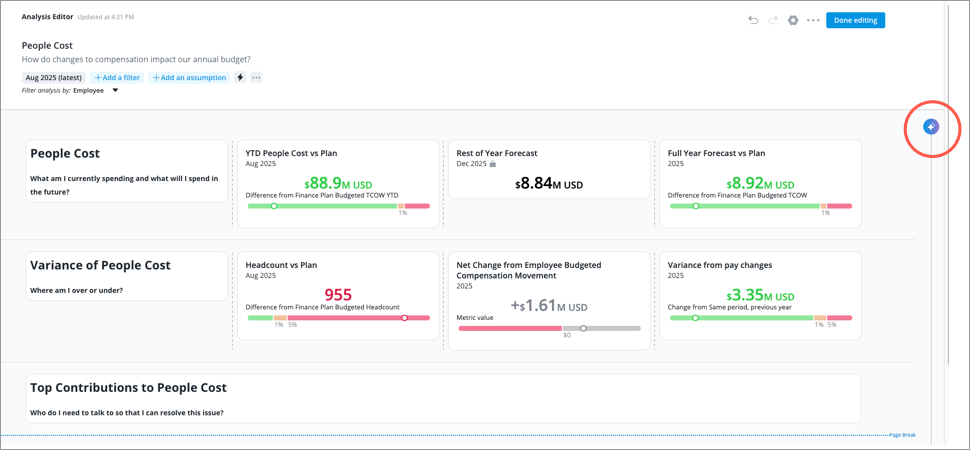
- Select the source content that will be used to generate AI explanations.
Click the AI Explanations button
 .
.
- In the AI Explanations panel, under Included content, click Manual > Edit selection.
- Select the visuals and text you want to include in the AI explanations, and then click Apply in the upper-right corner. You can select a maximum of 25 visuals.
To preview the AI explanation generated from your selected content, click Preview in the AI Explanations panel. When finished, click the Back button
 to close the preview.
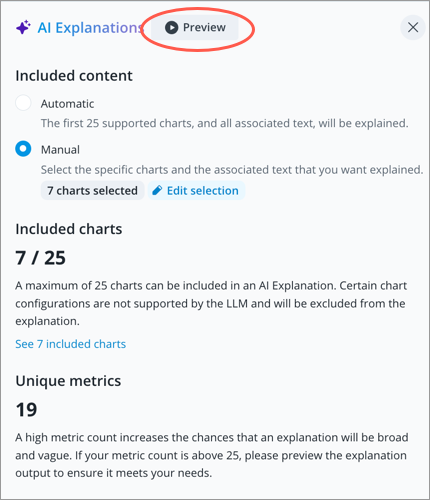
Tip: Check the AI Explanations panel to assess the quality of generated explanations:
- Click See included charts to review the data used to generate the explanations. This ensures the explanations use relevant information and align with your intended narrative.
Review the number of unique metrics included. The more metrics used to generate the explanation, the more likely it is to be broad or vague.
- When finished, click Done editing.
Note: To use the AI Explanation feature, viewers must have the Vee Boards permissions capability.
Best practices
When creating content for your Vee Board, follow these best practices to get the best performance and quality AI explanations:
- Structure your content in a clear, organized way so Vee can easily process and understand the data and narrative.
- Center the content around a single, clearly defined topic such as employee retention.
- Control your narrative by selecting the analysis title, visuals, and text to include in the AI explanation, then previewing the generated results. Keep in mind, AI is non-deterministic, meaning the same input may result in slightly different explanations each time you generate one.
- Limit the number of unique metrics in your visualizations. Including too many can make the explanation overly broad or vague, reducing its clarity and usefulness.
- Analyze Usage metrics to understand how users perceive and interact with the AI explanations. Use the Actions metric and filter by Action Name: AnalysisExplanation.
Supported visualizations
Vee analyzes the data behind the following visualizations to generate the AI explanation; other visualizations will be skipped if they're included in your Vee Board.
- Breakdown
- Bubble Grid
- Contribution
- Distribution
- Drivers
- History
- Movement Breakdown
- Movement Summary
- Pipeline Funnel
- Pipeline Trend
- Quadrant
- Relationship
- Table
- Trend
- Trend Breakdown
Note:
- You can show a separate AI summary for Text visuals. For more information, see Generate an AI text summary.
- Visuals that contain What-if projection metrics and plan metrics data are not supported.