Consume a Data Export Using Microsoft Excel
Fetch data from Visier using Microsoft Excel.
Access requirements
Permission with these capabilities: Consume Data Exports
Reach out to your administrator for access.
Prerequisites:
-
To perform this task you'll need a Data Export link, which may be provided by another user. For more information, see Generate a Data Export Link.
-
If your organization uses single sign-on when accessing Visier, contact your administrator to set up your Data Export credentials. For more information, see Data Exports and single sign-on.
Note:
- Data Exports is only supported in Excel 2016 and Excel 2013 for Windows.
- If you have Excel 2013, you'll need to download the Microsoft Power Query add-on.
-
When downloading data as a spreadsheet or consuming a Data Export, null (N/A) values in the visual will appear as blank (empty) cells in the destination.
-
To consume the Data Export in Excel, do one of the following:
Excel version Do this Excel 2016 In a worksheet, click the Data tab and then in the ribbon, click Get Data > From Other Sources > From Web in the Get & Transform Data group. Excel 2013 In a worksheet, click the Power Query tab and then in the ribbon, click From Web in the Get External Data group. -
If you're connecting to Excel for the first time, you'll have to authenticate by doing the following:
- In the Access Web Content dialog, click the Basic tab.
- In the User name box, enter your Visier username and password, and then click Connect.
-
In the From Web dialog, select Basic, paste the Data Export link in the URL box and then click OK. For more information about the Data Export link, see Generate a Data Export Link.
Result: The data loads and a preview window appears.
- In the preview window, click Load to populate your worksheet with data.
Format your worksheet
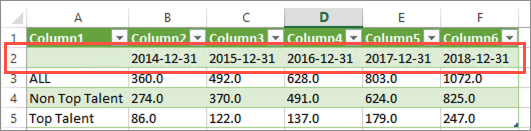
When data is loaded from an Aggregated Data Export into Excel, you'll see metric names or time periods loaded in the first row of your worksheet, as shown in the following screenshot.
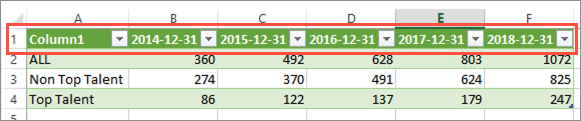
To make sense of the data, you can promote the first row and use them as your column headers in your worksheet, as shown in the following screenshot.
To promote the first row to column headers:
- In a worksheet, click the Query tab and then in the ribbon click Edit.
- In the Query Editor, click the Home tab and then in the ribbon, click Use First Row as Headers in the Transform group.
- When you're finished, click Close and Load.
Refresh data in Excel worksheet
If the Data Export is configured to display the latest data, you can refresh the connection in Excel so your worksheet contains the most recent data.
- In the Excel worksheet, click the Data tab and then in the ribbon, click Refresh All > Refresh in the Connections group.
If you make changes to your Data Export in Visier, you must manually refresh the data in your third-party tool or web application to see the updates. When you refresh, the updated data will overwrite the existing data.
Note: You may encounter an error when refreshing your data if the display name of a metric or attribute used in your Data Export has been changed in Studio. To fix this, you will have to update the name used in the third-party tool or web application and try again.
Adding or removing columns in your Data Export
If you add or remove a column in your Data Export in Visier, the new column will not be reflected, or an error message may appear when refreshing your Excel worksheet. For example, your Data Export has Overall, Headcount, Age, and Gender columns, and you add Tenure as a new column, the new Tenure column will not appear when the data is refreshed in your Excel worksheet.
To fix this, you will have to manually edit the Excel worksheet's Query Settings and try again.
Do the following:
-
Click the Data tab and then in the ribbon, click Queries & Connections.
-
In the panel on the right side, select the query you want to update and click Edit.
-
If you made changes to your Data Export in Visier by:
Option
Do this
Adding a column
-
Increase the number of columns in the Source formula.
Removing a column
-
Decrease the number of columns in the Source formula.
-
Remove the column header from the Changed Type formula.
-
-
Click the Data tab and then in the ribbon, click Refresh All > Refresh in the Connections group.
Result: The data will appear in the Excel worksheet as intended.
Data structure for Aggregated Data Exports
When consuming an Aggregated Data Export, you may notice differences in how the data is structured in Visier and your third-party tool or web application:
- Columns that contain mixed data types will be exported as strings. For example, if a column in the Aggregated Data Export contains strings (Exceptional, Good, Poor) and numbers (10.3% 39.0%, 89.7%). The data type for this column in the third-party application will be string.
- Currency codes and percentage symbols will not be included when you consume the Aggregated Data Export.
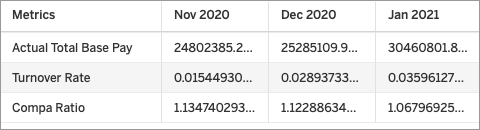
For example, the currency codes and percentage symbols appear alongside the amount in the Aggregated Data Export.
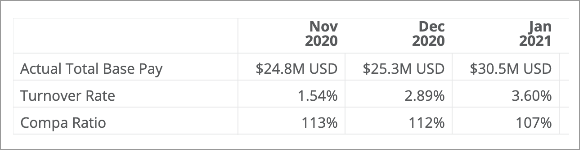
However, you will only see the amount in the third-party application, as shown in the following screenshot.