
Cohorts
Conduct cohort analysis to see how a specific population changes over time.
Overview
A cohort is a population of subject members (such as applicants, employees, and requisitions) that share similar attributes or experience common events at a specific time. Cohort analysis allows you to support use cases such as:
- Do leaders completing a leadership course get promoted at a different rate than those who do not?
- How many high performing women at the end of 2022 are still with the organization?
Cohorts capture a population of subject members. Subjects are entities, or separate and independent things, that have attributes that evolve over time, such as Applicants, Employees, and Requisitions.
For example, an Employee is a subject with attributes such as Direct Manager. When an employee's manager changes, that change to the subject's Direct Manager attribute is captured over time. Cohort analysis is only available for subjects because it's all about analyzing how a population changes over time. Other examples of subjects you can analyze include groups of Applicants or Requisitions.
When you define a cohort, the metric you select in the metric picker on the chart first will determine the subject that defines your cohort. So, if you want to define a cohort of Employees, choose the subject-based metric Headcount. Other subject-based metric examples include groups of applicants, such as Current Applicants, Applicants Active in Period, or New Applicants in Period, and groups of requisitions, such as Open Requisitions, Open Positions for Open Requisitions, or Requisitions Closed Filled in Period. The metric you select is only used for defining the subject of the cohort, it is not the outcome you want to analyze from the cohort. After you define the cohort, you can switch the metric to analyze outcomes such as Resignation Rate.
You cannot define cohorts for event-based or overlay metrics because they only exist in a single time frame, such as Employee Exit, Engagement, and Hire. An event represents an incident at a specific point in time that occurred to a subject. Events are instantaneous, therefore they have no lifetime to analyze.
For example, an Interview is an event that occurs at a point in time and is associated with an Employee subject (the interviewer) and an Applicant subject (the interviewee). You cannot define cohorts for a metric based on the Interview event such as Interviews in Period because there are no future outcomes to track about the interviews after they occurred. You can, however, define a cohort for the employees and applicants that experienced the interview during the same period.
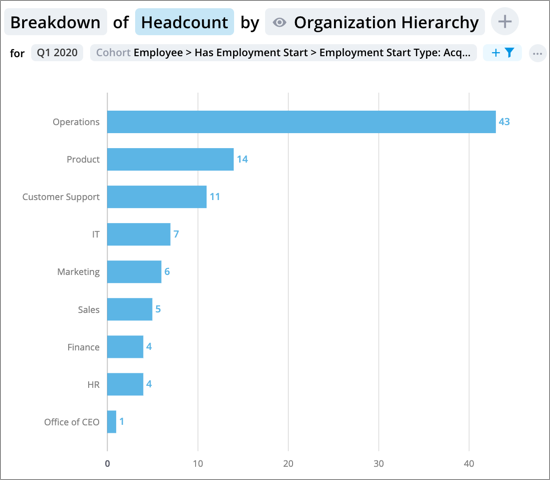
Let's look at a group of employees who started in the third quarter of 2017. This population is a cohort because they experienced a common event during the same period, an Employment Start Event in Q3 2017. Cohort analysis involves tracking and deriving insights from the behavior of a particular cohort. For example, calculating how many of the employees who started in Q3 2017 are still with the organization in Q1 2020, as shown in the following chart.
Best practices
Here are some best practices and guidelines to follow when working with cohorts:
- Always select a metric in the metric picker first as it will determine the subject that defines your cohort. For example, select Headcount if you are analyzing a cohort of employees on the Employee subject. Do not set the metric to the outcome you want to analyze on the cohort, such as Resignation Rate or Promotion Rate. After you define the cohort, you can switch the metric to analyze those outcomes.
- When defining your cohort, you can verify that the correct subject is being used by checking for the subject term next to the complement box. For example, if you selected the Headcount metric, you should see "Employee members that were in all of" in the cohort dialog.
- Be precise and choose a short time period when defining your cohort in the cohort dialog. This allows for a fair analysis of the cohort as they will have experienced a common event at the same time, and have the same amount of time after to achieve the outcome you are measuring.
- By definition, cohorts are defined at one point in time, and analyzed over a different, usually longer period of time. When analyzing the outcomes of the cohort, select a longer time period in the chart, typically immediately after the time period used to define the cohort. For example, if you defined your cohort using January 2021, set the time period in the chart to be the very next 12 months, starting at February 2021.
- When analyzing employee outcomes such as those who completed a course, always choose Has Learning Completion. This is the group of people that finished the course, not just those that participated in it.
- Groups and key groups cannot be created or used in projects.
For an example of how to create, define, analyze, and compare cohorts, see Cohort Examples.
In this section