
Add Focus
The focus workflow allows you to show or hide specific visual items.
Overview
When you add a grouping to your chart, the amount of chart items displayed may make your chart hard to read and understand. You can add focus to your chart to show data for specific attribute values that you are interested in.
Adding focus is different from adding filters because you are not reducing the data that is included in the chart. The overall metric value remains the same when you show or hide chart items.
For example, you're looking at the Breakdown of Resignation Rate by Employee > Job Family, as shown in the following screenshot.
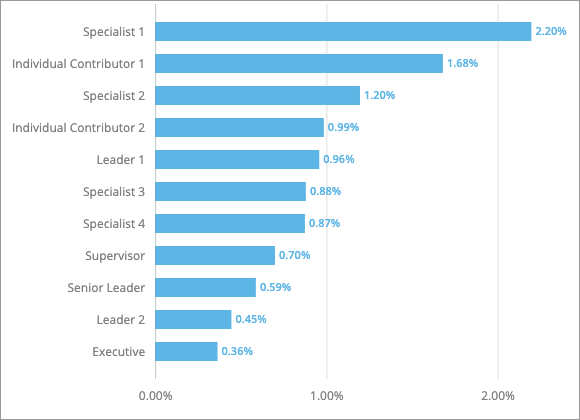
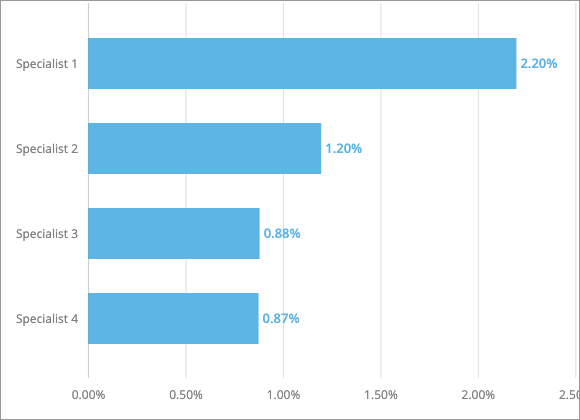
Let's say you're only interested in analyzing data for Specialists, you can add focus and hide all the other chart items.
You can also create custom groups to combine attribute values into one chart item. Using the previous example, you can create a group that contains all the Specialist levels (1 to 4).
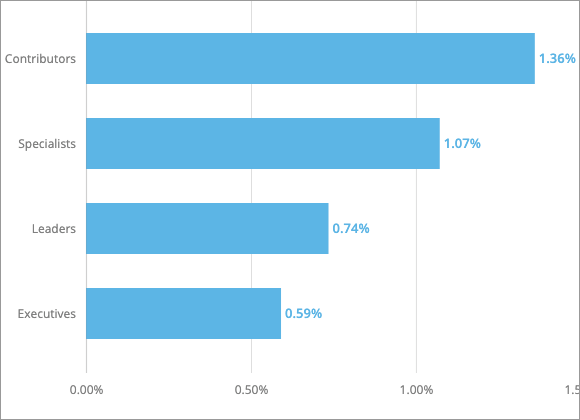
Creating custom groups will allow you to answer different types of questions such as what is the Resignation Rate for all Specialists in the organization? For more information about creating and using groups, see Create a Group.
You also have the option of creating custom ranges (bins) for numeric attributes like Base Pay and Tenure. For more information, see Range Sets.
Add focus to stacked bar visuals
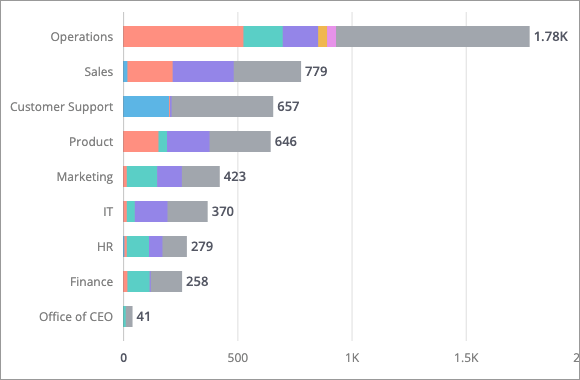
If you are using the stacked Breakdown visual, you can add focus to your secondary group by to show or hide specific bar segments. For example, you're looking at the Breakdown of Headcount by Organization Hierarchy & Job Family, as shown in the following screenshot.
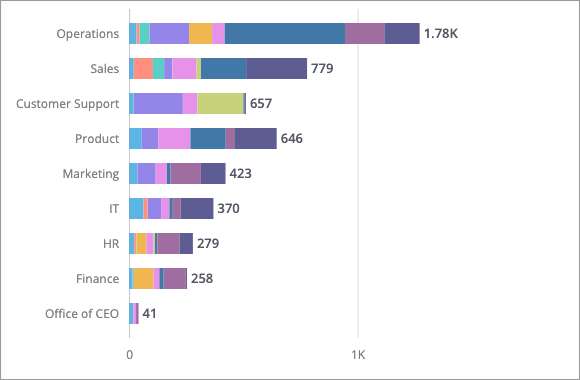
Let's say you're only interested in analyzing data for Specialists, you can add focus to the Job Family grouping and hide the other segments. By doing this the chart becomes less cluttered and easier to understand.
Custom groups can also be applied to the stacked Breakdown and Trend Breakdown visuals. When adding focus alongside custom groups to the secondary grouping, ensure that you don't choose overlapping attribute values.
The selected groups cannot contain:
- Attribute values that you’ve selected to show. For example, if you choose to show Specialist 1, then you won't be able to show a Group that contains Specialist 1.
- The same attribute values as another Group.
Add focus
To show or hide specific chart items:
- In the visual title, click the Add focus button
 for the grouping that you want to show or hide chart items for.
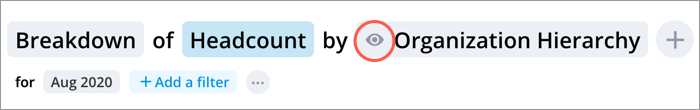
- In the Focus on picker, select the attribute values or groups you want to show. For more information about groups, see Create a Group.
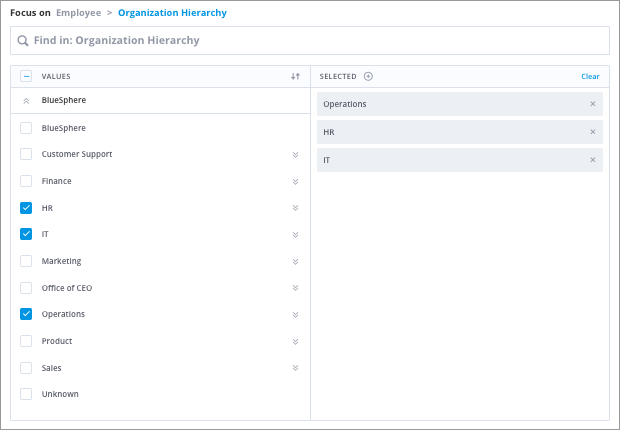
Based on the selected attribute values in the screenshot, the resulting visual will show chart items for the back office (Operations, HR, and IT). - Click Apply.