Change How a Metric is Computed
Change the trailing time calculation or parameter values for a metric.
Access requirements
Permission with these capabilities: Ad Hoc Analysis
Reach out to your administrator for access.
You will find additional options that will allow you to change how metrics are computed when the Metric picker is in full screen.
To open the Metric picker in full screen:
- Click the Metric picker in the visual title.
- Click See all metrics.
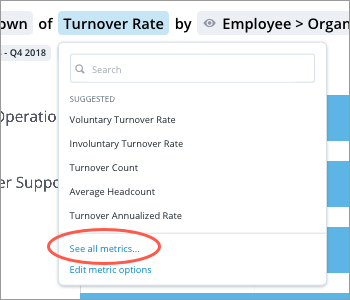
Note: You can also click Edit metric options to open the Metric picker in full screen when an over-time, parameterized, or plan is selected.
Change trailing time
Note: By default, the trailing calculation is turned off for all metrics. To turn on the trailing calculation for a specific metric, contact Visier Technical Support.
You can change the default per period calculation for over-time metrics to a trailing calculation. In a trailing calculation, each data point represents the net value of prior time periods of a specified length (for example, last 4 quarters and last 12 months). This option is only available for over-time metrics because data from prior time periods will be added to calculate a metric value. Trailing time is useful when analyzing data where seasonal fluctuations can make it hard to understand the underlying trend.
The following chart shows a Trend of Revenue where the trailing time has been set to 6 months.
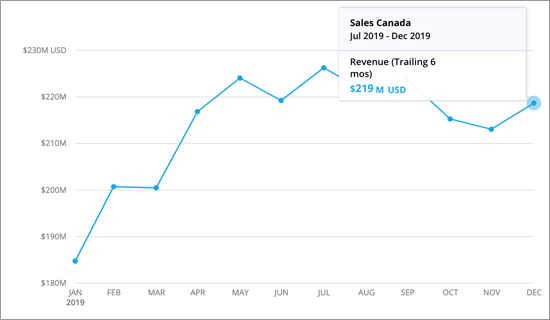
Each data point represents the total Revenue from the previous 6 months. In this example, the Revenue for December 2019 is the total revenue from July 2019 to December 2019.
To change the trailing time:
- With the Metric picker in full screen, select an over-time metric.
- Click Add trailing time.
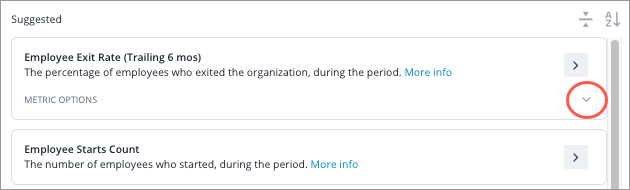
Result: The Metric Options area expands.
- Select a preset or set a custom interval by entering the number of time periods and granularity you want to use for the trailing time calculation.
-
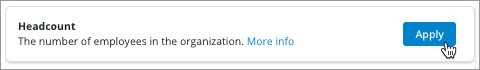
When finished, click Apply on the right side of the metric card.
Change metric parameters
Parameterized metrics are metrics that use dynamic values (parameters) in their formulas. When working with parameterized metrics, you can change how the metric is computed, on the fly, by changing the parameter value.
Depending on the metric, the parameters that you can change can be one of the following types:
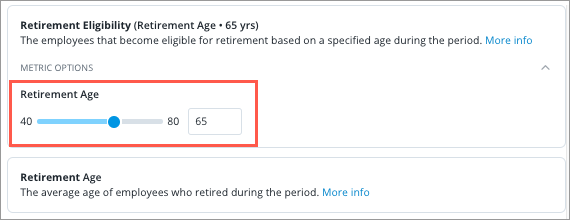
- Numeric: A parameter with a numeric data type. For example, Retirement Eligibility is a parameterized metric that uses a dynamic numeric value for the retirement age. The metric uses a default value of 65 to calculate the number of employees who are eligible for retirement. However, you can change this value to see the impact on your organization if the mandatory retirement age changes to 60 or 70.
- Member: A filter parameter that can be set with optional dimension member selection. For example, Employee Intersectionality Ratio is a parameterized metric that allows you to filter on the numerator to select the employee population you want to analyze. If you only want to analyze millennial women, you would apply a filter to the Gender parameter (Woman) and Employee Attribute parameter (Generation > Millennials).
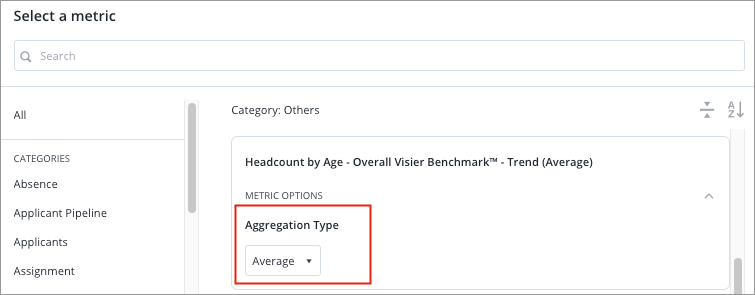
- Aggregation: A parameter that aggregates property values. For example, Headcount by Age - Overall Visier Benchmark™ - Trend is a parameterized metric that allows you to select aggregation values for the 10th, 25th, Median, 75th, and 90th percentiles. The metric uses a default value of Average to calculate the average proportion of headcount by age across all industries and company sizes. However, you can change this value to 10th percentile if you only want to analyze the proportion of headcount by age at which 10 percent of organizations are below.
Note: Metrics with aggregation parameters will have the default aggregation value in parentheses in the metric name. This will update to reflect the aggregation type you select.
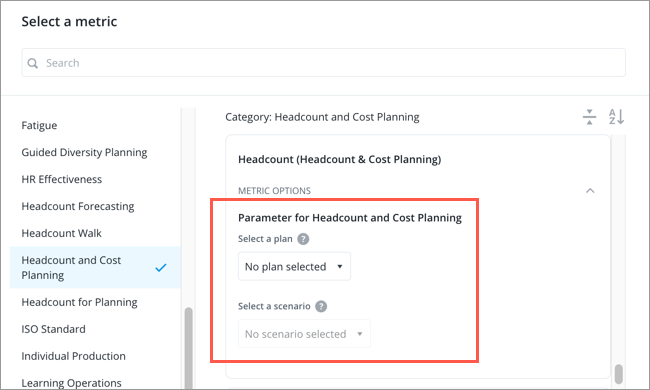
- Plan: A plan parameter that can be used to select a plan and scenario. For example, Headcount (Headcount and Cost Planning) is a parameterized metric that allows you to set where the plan metric is getting data from by changing the plan and plan scenario parameters.
- Subject member set: A parameter which allows the user to select a set of subject members as well as hierarchy values associated with those members. For example, Employee Skill Profile Gap is a parameterized metric that allows you to select the skills on the Skill subject that you want to include for analysis. This metric compares an employee's skill set to the ones selected in the parameter.
- In the visual title, click the Metric picker.
- Select a parameterized metric.
- Do one of the following:
Option Do this Change a numeric parameter - Move the slider or enter a new parameter value in the Parameter box.
Change a filter parameter - If there is no default attribute selected, click Add metric option.
- Do one of the following:
- If the parameter is associated with a specific attribute, click the Add or edit button .
- If the parameter is not associated with an attribute, click the Add filter button.
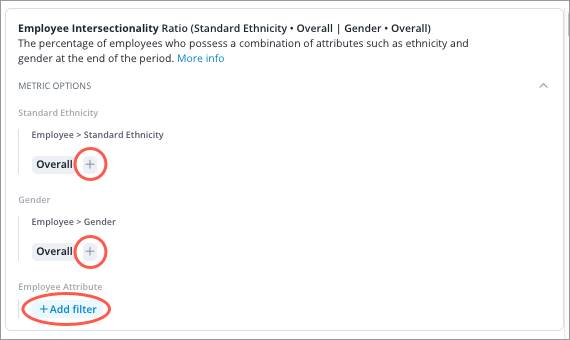
In this example, the Standard Ethnicity and Gender parameters are associated with specific attributes while the Employee Attribute parameter is not.
- In the Filter picker, select the attribute values you want to include and then click Apply.
Change an aggregation parameter - Under Metric Options select the aggregation type.
Change a plan parameter Set where the plan metric is getting data from by changing the plan and plan scenario parameters.
- Click Add metric option for the plan metric you want to analyze.
- Under Metric Options select:
- The plan name.
- The plan scenario.
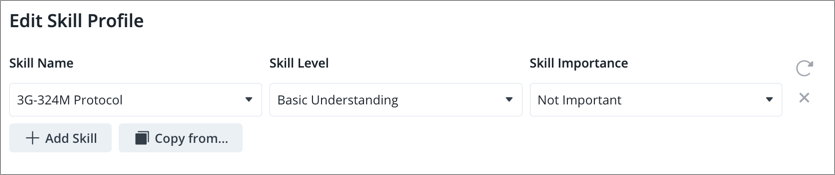
Change a subject member set parameter
Do one of the following:
- To add individual dimension members, click Add.
- To copy an existing set of dimension members from a related subject, such as Employee, click Copy from.
- Move the slider or enter a new parameter value in the Parameter box.
-
When finished, click Apply on the right side of the metric card.
Tip:
If you don't see the metric options in full screen, click the Expand button on the right side of the metric card to show the metric options.