
Add a Reference Line
Add a reference line to your visual to compare, measure, or emphasize a specific value.
Access requirements
Permission with these capabilities: Ad Hoc Analysis
Reach out to your administrator for access.
Overview
A reference line is a vertical line on a chart that marks a key value, such as a target, benchmark, or threshold, making it easier to interpret and compare data. You can add a single reference line to indicate the overall metric value, or add separate reference lines to indicate the metric value of each group in the visualization.
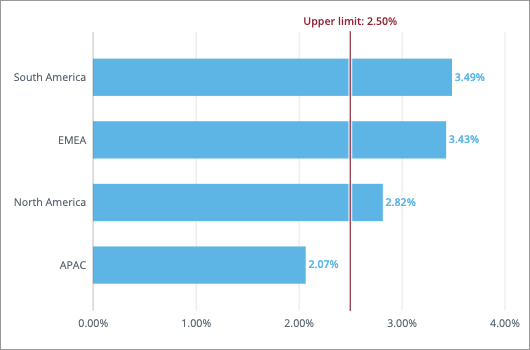
Display a single reference line when you want to compare all data points against the same standard. This approach provides essential overall context and enables you to quickly identify outliers across all groups. For example, you can use a single reference line to show how each location is performing against your company-wide retention goal. By using the Custom value reference line type, you can add a vertical line to highlight the upper limit of the Employee Exit Rate, making it easy to identify locations that exceed this threshold. The following screenshot shows a reference line indicating the upper limit of the Employee Exit Rate at 2.50%.
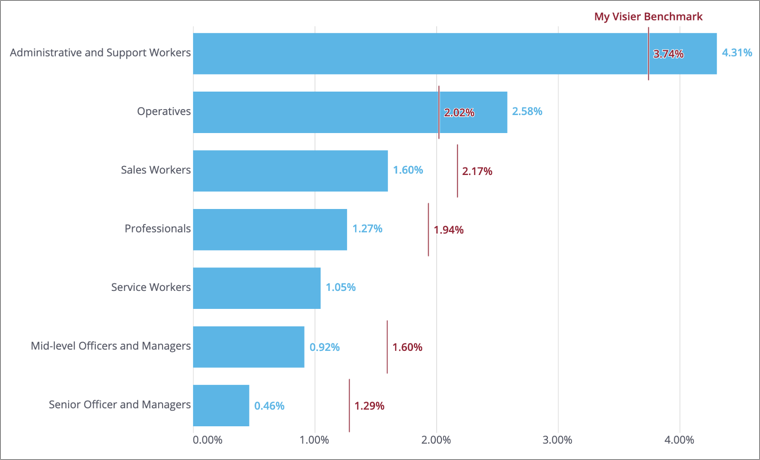
Display separate reference lines when you want to provide group-specific context, compare performance across categories, or visualize individual benchmarks for each group within a chart. This approach allows for a fair comparison when groups have inherent differences. For example, showing a single, overall industry benchmark for Employee Exit can be misleading, as the standard can vary significantly across specialized job functions. By using the Metric value reference line type with the Reference line per group option, you can compare each function's performance against its own specific Visier Benchmark.
Note:
- This type of comparison is available for the Breakdown and Trend Breakdown visual.
- The Time period reference line type is only available for the Breakdown visual.
- If your visual contains incomplete data, the reference line calculates the previous period’s value using data from the same partial period to maintain a like-for-like comparison.
- The Reference line per group display option is only available for the Breakdown visual.
- Data must be available for the reference line comparison metric and selected group by. For example, you add a reference line to show Certifications Count by Location, the group-specific reference lines will appear if location data has been loaded for certifications.
- The reference line comparison metric must be compatible with the selected group by dimension. For example, you have a visual showing the Breakdown of Headcount by Location with reference lines indicating the Site Capacity per Location. This works because the Site analytic object has the Location dimension. If you change the primary group by to Disability Status, the reference lines are removed because the Site analytic object does not have a Disability dimension, making the per group calculation incompatible.
- Reference lines per group will be removed when a secondary group by is added to the visual.
Add a reference line
- Click the Compare to button
 on the Visual Actions menu to create a comparison.
Tip: If you want to add a reference line to your existing comparison (for example, metric comparison), click Add another comparison in the Compare to panel.
- In the Compare to panel, click Reference line.
- If you're adding a reference line to an existing comparison, choose the comparator to use as the basis for your reference line in the Select comparison list.
- Choose the reference line type in the Add Reference line panel:
To add a reference line for Do this Overall value of the selected metric Select Overall.
The Overall option is only available for non-additive metrics (such as ratios and rates). A non-additive metric is a metric whose values for different populations cannot be summed to calculate an overall value for the combined population.
Specific metric value Select Custom value and then enter the metric value where you want the reference line to appear in the Value box.
Note: The custom value is not expressed in the same units as the values in the chart. For example, if your chart is expressed in millions and you want to add a reference line for 50 million USD, you must enter the value 50000000.
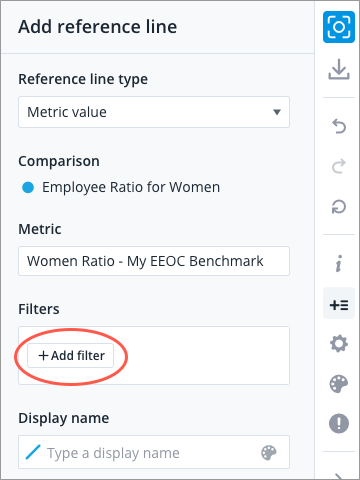
Value of another metric - Select Metric value and then click Add metric.
- In the Metric picker, select the metric you want to compare.
- Optional: Click Add filter to refine the population of the comparison metric.
Under Display, choose whether to show a single or multiple reference lines.
- To show a single reference line for the overall metric value, select Overall reference line.
- To show separate reference lines for each group's metric value, select, Reference line per group.
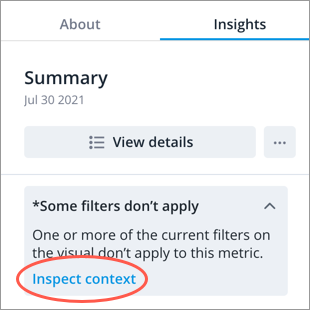
Note: The analysis context for your visual (filters, assumptions, and security permissions) will also be applied to the comparison metric. If any part of the analysis context cannot be applied to the comparison metric, you'll see the Some filters don't apply note in the Insights tab of the Info panel. Expand the note and click Inspect context to find out what parts of the analysis context has been applied to the comparison metric.
Time period
- Select Time period, and select a preset period or set a custom period.
Under Display, choose whether to show a single or multiple reference lines.
- To show a single reference line for the overall metric value, select Overall reference line.
- To show separate reference lines for each group's metric value, select, Reference line per group.
- Customize the appearance of the reference line:
- Enter a label for the reference line in the Display name box.
- Select the color of the reference line by clicking the Change color button
 in the Display name box.
- Click Add.
- To add another reference line, click Add another comparison in the Compare to panel and repeat steps 2 to 6.
Note: You can add a maximum of 4 reference lines.
-
To rename comparators, select the comparator in the Compare to panel, enter a display name, and click Done.
Note:
- The custom display name is used in the visual title, captures, and chart cards in an analysis.
- Changing the display name of comparators in a capture or chart card will not affect other existing captures or cards.