
Add Traffic Lighting Rules
Define rules to apply traffic lighting colors to data in a visualization.
Tip: Watch this video to learn how to add traffic lighting to your visual.
You can apply traffic lighting to highlight the metric values themselves or the difference values displayed in your visualization.
Traffic lighting can be added to the following visual types:
|
Visual Type |
Metric Traffic Lighting |
Difference Traffic Lighting |
|---|---|---|
|
Breakdown |
Yes |
Yes, metric, group, scenario, and time period comparisons |
|
Trend |
Yes, when there are no group bys |
Yes, metric, group, legend items, scenario, and year comparisons |
|
Trend Breakdown |
Yes, when there are no group bys |
Yes, metric, group, scenario, and year comparisons |
|
Table |
Yes |
Yes, calculated difference columns |
|
Movement Breakdown |
Yes |
|
For more information about how traffic lighting rules are evaluated, see Traffic Lighting Examples
Add metric traffic lighting
Metric traffic lighting uses color to highlight how good or bad a metric's current value is based on defined thresholds or comparisons.
-
Click the Traffic light button
 on the Visual Actions menu.
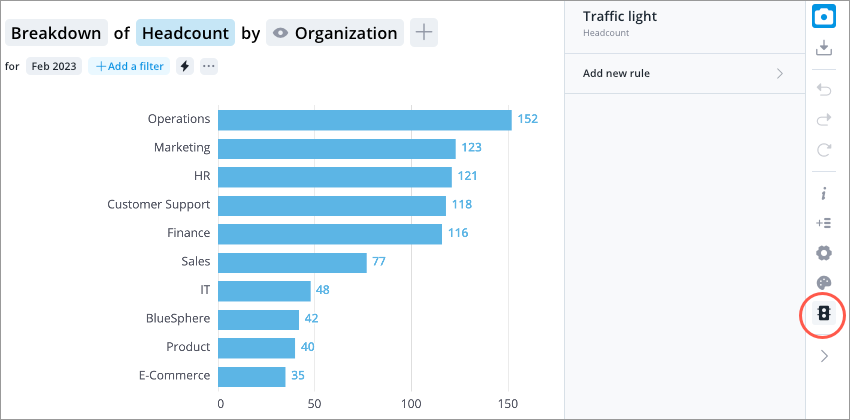
- Click Add new rule in the Traffic light panel. For the Table visual, click Add new rule set, and select the metric you want to apply traffic lighting to.
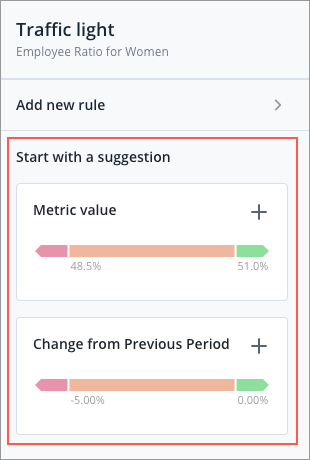
Note: If available, you can also start with a suggested traffic light rule. Suggested rules are configured by your administrator. For more information, see Configure Suggested Traffic Lighting Rules.
- Select one of the following rule types:
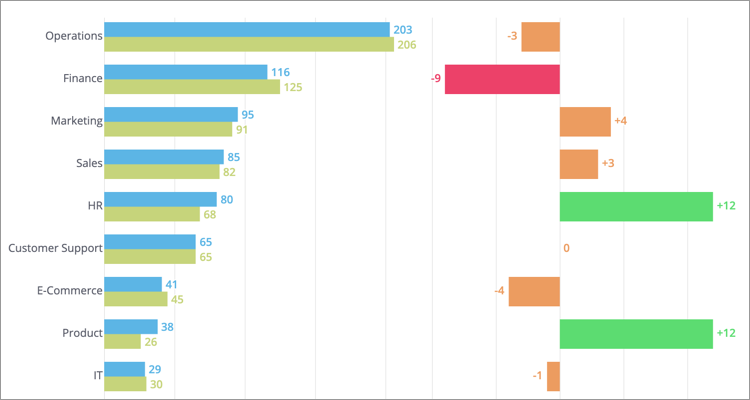
Note: The following table uses the example where metric traffic lighting is being applied in a Breakdown of Headcount by Organization Hierarchy. As shown in the previous screenshot, the visual items consist of the groupings: Operations, Sales, Finance, and more.
Rule Type Description Explanation Metric value The metric value for each visual item is compared to a target value. Rule: If the metric value is less than 250, traffic light as Bad.
For example, the Headcount for Sales is compared to the target value of 250 in the selected period. If the Headcount value for Sales is less than 250, then the visual item will be highlighted in red.
Change in metric value The metric value for each visual item in the selected time period is compared to the metric value from a previous time period. Rule: If the change from February 2020 is less than 5%, traffic light as Good.
For example, the Headcount for Marketing is compared to the Headcount for Marketing in February 2020. If the percentage change from the previous time period is less than 5%, then the visual item will be highlighted in green.
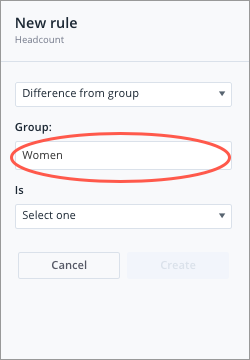
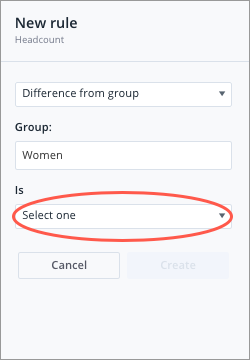
Difference from group The metric value for each visual item is compared to the metric value of another population. Rule: If the difference from Women is greater than 20%, traffic light as Bad.
For example, the Headcount for Marketing is compared to the Headcount for Women in Marketing. If the percentage change from the other population is greater than 20%, then the visual item will be highlighted in red.
Difference from another metric The metric value for each visual item is compared to another metric. Rule: If the difference from Employee Exit Count is greater than 500%, traffic light as Bad.
For example, the Headcount for Finance is compared to the Employee Exit Count for Finance. If the percentage change from the other metric is greater than 500%, then the visual item will be highlighted in red.
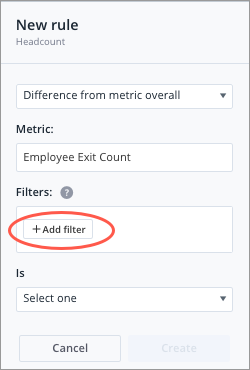
Difference from metric overall The metric value for each visual item is compared to the overall value of another metric. Rule: If the difference from Employee Exit Count is greater than 200%, traffic light as Concerning.
For example, the Headcount for Finance is compared to the Employee Exit Count for the entire organization. If the percentage change from the overall value of the other metric is greater than 200%, then the visual item will be highlighted in amber.
For more information about the percentage change calculation, see How the difference between metric values is calculated.
- Depending on the rule type you selected, do the following:
Rule Do this Metric value Skip to step 5. Change in metric value - Click Select a time period.
- Select one of the preset options or click Add time period to define a custom time period.
When adding metric traffic lighting to the Table visual, a custom time period can not be set when using the Change in metric value rule type. You can only use the Same period, previous year or Previous period presets.
Difference from group - Click Select a group.
- In the Filter picker, select the attribute values that describe the population you want to compare for the traffic light, and then click Apply > Done.
- Optional: Add additional filters to refine the population by clicking the group that you added.
Difference from another metric - Click Select a metric.
- In the Metric picker, select the metric you want to compare for the traffic light.
Difference from metric overall - Click Select a metric.
- In the Metric picker, select the metric you want to compare for the traffic light.
- Optional: Click Add filter to refine the population of the comparison metric.
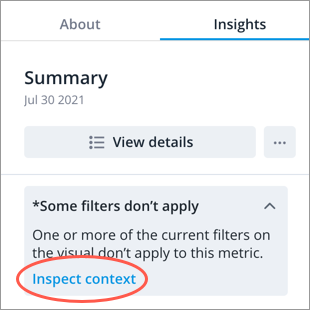
Note:
The analysis context for your visual (filters, assumptions, and security permissions) will also be applied to the comparison metric. If any part of the analysis context cannot be applied to the comparison metric, you'll see the Some filters don't apply note in the Insights tab of the Info panel. Expand the note and click Inspect context to find out what parts of the analysis context has been applied to the comparison metric.
- Define the conditional expression under Is in the Rule panel. Select the condition and then type the target value. For example, Less than 50, Between 40% and 50%, or Greater than 20%.
Note: For the Between conditional expression, the lower limit value is included and the upper limit value is excluded.
- Assign a status to the rule under Traffic light as.
By default, the traffic lighting statuses are linked to the following colors:
- Bad: If the value meets the rule, the visual item will be highlighted in red.
- Concerning: If the value meets the rule, the visual item will be highlighted in amber.
- Good: If the value meets the rule, the visual item will be highlighted in green.
- Neutral: If the value falls outside the range of the defined rules, the visual item will be highlighted in gray. This status cannot be manually assigned to a rule.
After creating your rule, you can choose a different color palette if available. Colors in the palette are arranged from left to right as: neutral, good, concerning, and bad.
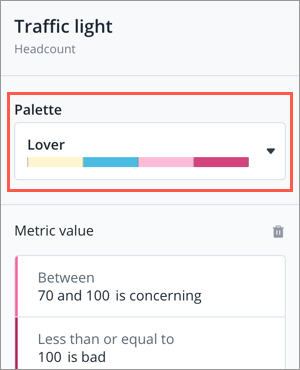
For more information on creating custom color palettes as an administrator, see Create a Custom Color Palette.
- Click Create.
- To add additional rules, click Add rule to metric and repeat steps 5 to 7.
Add difference traffic lighting
Difference traffic lighting uses color to highlight a metric's change, indicating how good or bad the calculated difference is based on defined thresholds. This option is available for comparison visuals that explicitly display a difference between two metrics, groups, scenarios, time periods or legend items.
- Create a visualization that compares two metrics, groups, scenarios, time periods, or legend items. Click the Compare to button
 on the Visual Actions menu to create a comparison. For more information, see How to Create Comparisons.
 -
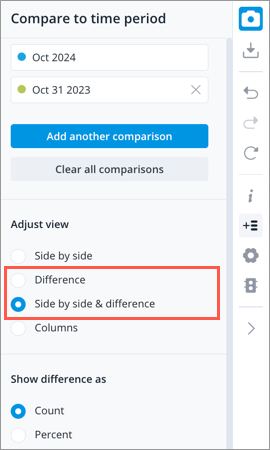
To show the calculated difference in the visual, select a difference view from the Compare to panel. The traffic lighting option will only appear once a difference view is chosen. For the Table visualization, add a calculation column to calculate the difference between two metrics. For more information, see Working with calculations.
-
Click the Traffic light button
on the Visual Actions menu.
- Click Add new rule set in the Traffic light panel. For the Table visual, select the calculated difference column you want to apply traffic lighting to. Define the conditional expression for the Difference rule type. Select the condition and then type the target value under Rule. For example, Less than 50, Between 40% and 50%, or Greater than 20%.
Note:
- Difference is the only rule type that can be selected, where the difference metric value for each visual item is compared to a target value. Let's say your traffic light rule is: if the difference value is less than 250, traffic light as Bad. The calculated difference, the metric value that appears in the visual, will be compared to the target value of 250. If the calculated difference is less than 250, then the visual item will be highlighted in red.
- The unit of measurement (count or percent) for the difference rule is determined by the selected comparison view and metrics being compared in the visualization.
- For the Between conditional expression, the lower limit value is included and the upper limit value is excluded.
- Assign a status to the rule under Traffic light as.
By default, the traffic lighting statuses are linked to the following colors:
- Bad: If the value meets the rule, the visual item will be highlighted in red.
- Concerning: If the value meets the rule, the visual item will be highlighted in amber.
- Good: If the value meets the rule, the visual item will be highlighted in green.
- Neutral: If the value falls outside the range of the defined rules, the visual item will be highlighted in gray. This status cannot be manually assigned to a rule.
After creating your rule, you can choose a different color palette if available. Colors in the palette are arranged from left to right as: neutral, good, concerning, and bad.
For more information on creating custom color palettes as an administrator, see Create a Custom Color Palette.
- Click Create.
- To add additional rules, click Add rule to metric and repeat steps 5 to 7.
- When finished click Apply.
How traffic lighting rules are evaluated
The traffic lighting rules are evaluated in the order they appear in the Info panel from top to bottom. Once a rule is met, the remaining rules are not evaluated.
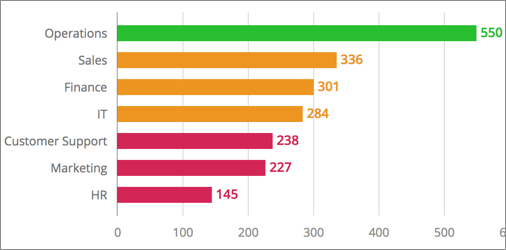
For example, you applied the following traffic lighting rules to the Breakdown of Headcount grouped by Organization Hierarchy:
- Metric value is greater than or equal to 250. Traffic light as Concerning.
- Metric value is greater than 500. Traffic light as Good.
- Metric value is less than 250. Traffic light as Bad.
As shown in the following illustration, the headcount for Operations is 550 and its metric value is highlighted as concerning (amber) and not good (green).
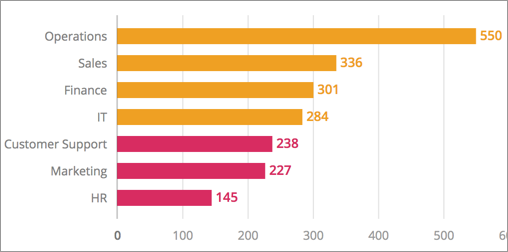
In this case, the headcount for Operations meets the first condition, so the remaining rules are not evaluated. To put your traffic lighting rules in the correct order, see Reorder Traffic Lighting Rules.
How the difference between metric values is calculated
When comparing metric values using percentages, the relative difference is calculated by subtracting the primary (reference) metric from the secondary (comparison) metric, and then dividing the difference by the secondary metric.
For example, you want to compare the overall Turnover Rate to the Turnover Rate for women, where:
- The overall Turnover Rate is 10.0% (primary metric)
- The Turnover Rate for Women is 30.0% (secondary metric)
The relative difference or percentage change is calculated as follows:
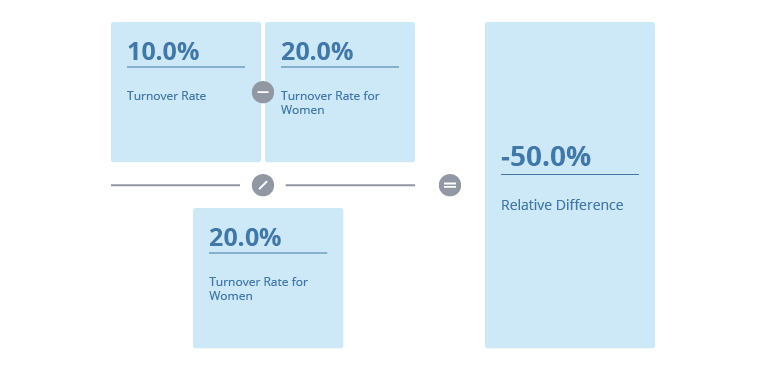
This formula is also used when evaluating the conditional rules for analysis email delivery and traffic lighting.