
Currency Conversion
Learn how Visier converts currency.
When converting values to a single currency the solution does so using a process called “constant currency”. This means that only one exchange rate (per currency) is used for a calculation, even if it spans multiple periods. The exchange rates used are based on the last day of the selected period in the Time picker.
Note: Currency conversion for plan metrics
- The solution uses the exchange rates from the baseline period of the plan to convert plan currencies. As a result, you may notice different exchange rates being applied when comparing actuals to plan metrics in a selected period.
- Optional: You can load a separate currency file if you want to use a different set of exchange rates for plan metrics. Only plan metrics specifically based on the plan will use the Planning Currency Exchange value, not financial overlays inside Planning or in Explore.
The reason for using constant currency is that it allows for effective analysis of the change in costs over time. If a varying exchange rate is used then differences in values can be caused by different rates of exchange. These fluctuations are “invisible” in the analysis as they are applied to values prior to them being displayed. Using constant currency ensures that the slope of the trend line or the calculated difference between two periods is shown using a common exchange factor and hence provides the clearest way to show difference.
One outcome from using constant currency is that the values on a chart may change when the time period selected changes. This is due to the conversions being calculated using different exchange rates.
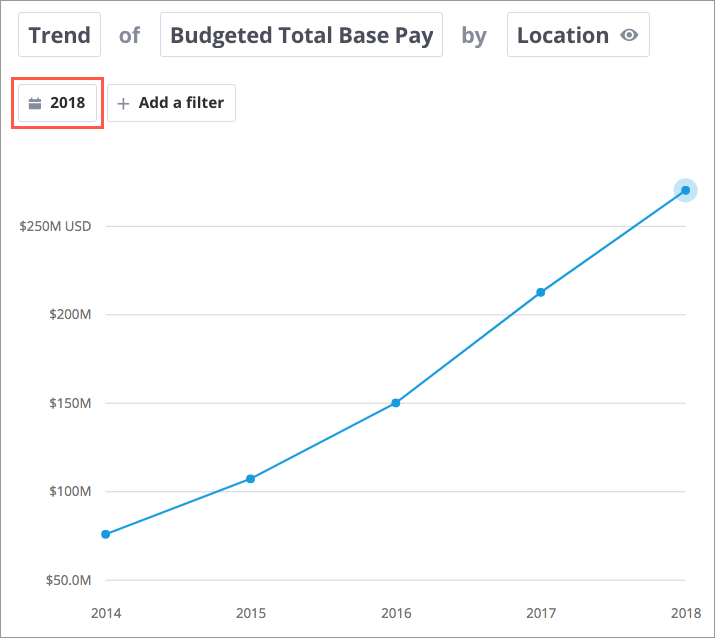
For example, when you view a trend chart, the exchange rates from the last day of the period set in the time picker is used to normalize the values of all periods. In the below example, 2018 is selected in the context bar, so the exchange rate from the last day of 2018 is used to calculate the values for 2014, 2015, 2016, 2017, and 2018 in this chart. This means the chart may shift when a different date in the analysis context is selected if the exchange rate for a currency has changed. You can check the Info panel to see details about the display currency and the exchange rate that was used.
Tip:
- If your visual contains converted currency values, you can find more information about the applied exchange rates in the About tab of the Info panel. Expand the Currency note to learn more.
- To get an exact breakdown of the exchange rates that are applied to the metrics in your visual, click the Download visual button
 on the Visual Actions menu, and then click Download data as spreadsheet. Select the Exchange Rates worksheet in the XLSX file to learn more.
- This download is only available for the Trend, Trend Breakdown, and Table visuals.