
Sort Chart Data
Organize chart data into a meaningful order to make it easier to understand, analyze, or visualize.
-
Click the Settings button
 on the Visual Actions menu.
 -
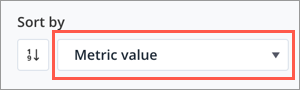
In the Chart Settings panel, under Sort by, choose the value that you want to sort the grouping by:
- To sort data based on the magnitude of the metric values, click Metric value.
- To sort data alphabetically based on the names of the attribute values, click Grouping order.
- To sort data based on the magnitude of the calculated differences between metric values, click Difference.
Note: The Difference option is only available when you're comparing metrics in a Breakdown visual with a Difference or Side-By-Side+Difference view.
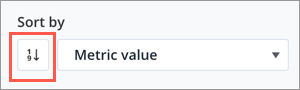
- Choose the sort order:
- To sort data from lowest to highest, click Ascending.
- To sort data from highest to lowest, click Descending.
You can sort data for the following visual types:
- Breakdown
- Bubble Grid
- Trend Breakdown
- Distribution
Tip: You can also change the sort order of the secondary grouping within a stacked bar and 100% stacked bar chart.