Download a Visual
Export visualizations or the data from a visualization to share or edit outside of the solution.
Who can use this feature?
Users with this permission capability:
-
Export to PowerPoint
Not sure if you have this feature or capability? Reach out to your administrator.
Download individual visualizations in a wide variety of file formats to share or use outside of the solution. For example, quickly download a high-resolution image of a chart, annotate it in the image editor of your choice, and embed it a report. You can download visualizations when conducting ad hoc analysis in Explore or viewing a visualization in full screen (for example, selecting a chart card in an analysis).
Note:
- The options that are available depend on the selected visual.
- You can also download all the visuals included in an analysis as a PPTX file. For more information, see Download an Analysis.
-
The Spreadsheet option will be unavailable if the export exceeds the following maximums. Decrease the amount of data displayed before downloading again.
- Table visual and Aggregated Data Exports can contain up to 100,000 cells.
- Detailed View visual and Detailed Data Exports can contain up to 1,048,576 rows or 7.5 million cells.
-
When downloading data as a spreadsheet or consuming a Data Export, null (N/A) values in the visual will appear as blank (empty) cells in the destination.
-
Only the first visual in a carousel will be included in analysis emails, visual downloads, and analysis downloads.
-
When downloading the Text visual as a spreadsheet only the original text will be included.
- Click the Download visual button
 on the Visual Actions menu.
 - In the Download visual panel, do one of the following:
- To download the chart as a PNG file, click Image.
- To download the visual as a PPTX file, click PowerPoint.
- To download the data as an XLSX file, click Spreadsheet.
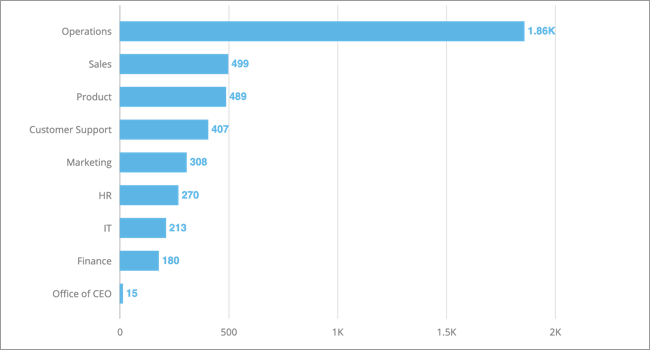
Example: Download visual as image
With this option, you get a high-resolution image of the chart.
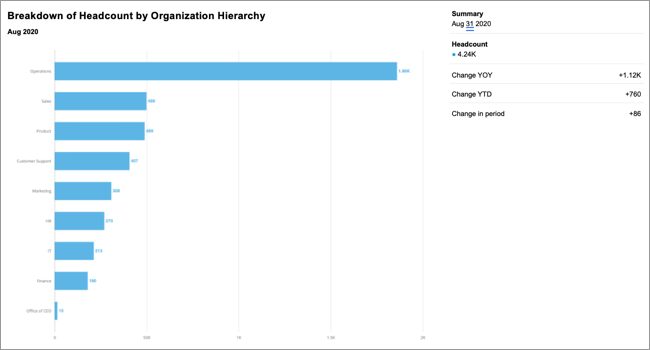
Example: Download visual as PowerPoint
With this option, you get a Microsoft PowerPoint slide that contains editable objects such as the chart, visual title, analysis context, and the Info panel. The file will display the Info panel tab that was selected when downloading the visual.
To customize the template that is used for PPTX downloads, contact Visier Technical Support.
Hierarchy display settings
When downloading an Aggregated Data Export as a spreadsheet or consuming the data in a third-party application, you can choose how hierarchies appear. You can have the levels of a hierarchy displayed as a single column or have them expanded into separate columns. Expanding hierarchy levels into separate columns makes it easier for you to understand the relationships and structure of the data. It also unlocks more ways for you to sort, filter, and analyze your data.
To display the levels of a hierarchy as separate columns for an Aggregated Data Export:
- Click the Download visual button
 on the Visual Actions menu.
 - In the Download visual panel, click the Expand hierarchies as columns toggle.
Note: The hierarchy display settings cannot be changed when downloading data for the Table visual. The levels of a hierarchy will be displayed in separate columns.
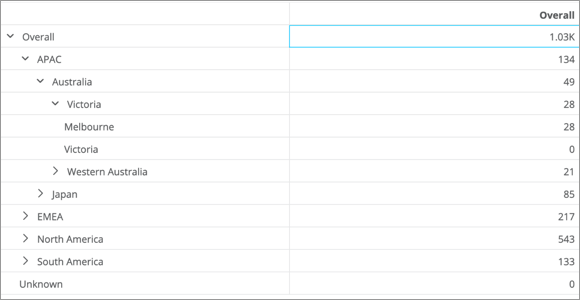
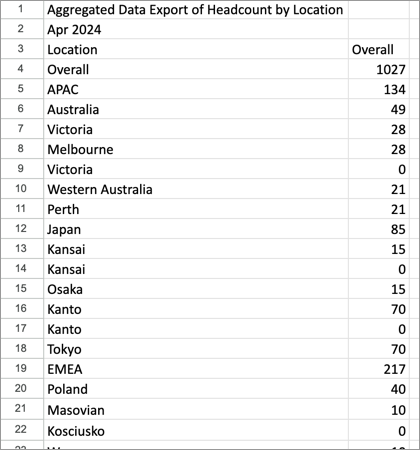
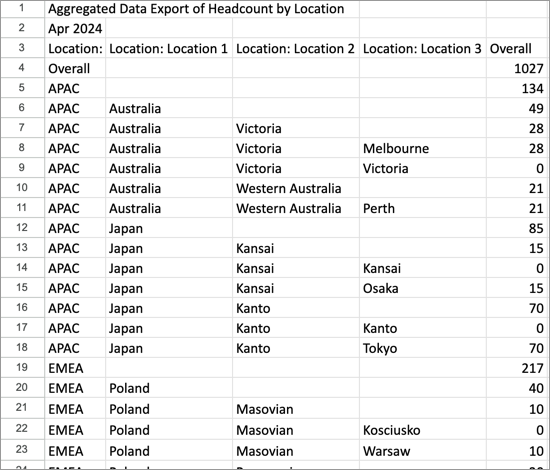
The following screenshots show an Aggregated Data Export in Visier and how hierarchies appear in the export based on the display setting.
Aggregated Data Export of Headcount by Location
For example, your Aggregated Data Export includes the Location Hierarchy grouping. You can expand and collapse these rows to drill down to view data at the Region, Country, or State levels in Visier.
Expand hierarchies as columns toggle is off
Locations appear in a single column and the hierarchical structure is lost.
Expand hierarchies as columns toggle is on
Locations appear in separate columns allowing you to see the different levels of the hierarchy.
Limitations
- For visualizations that display a large amount of data and require scrolling (for example, Table visual), only the current visible area will appear in the download.
