
Breakdown Visual
Compare the number, frequency, or any measure of two or more related groups.
Tip: Watch this video to learn how to use the Breakdown visual.
The Breakdown visual is a horizontal bar chart that uses bars to compare a specific measure across a series of groups. The vertical axis shows the groups being compared and the horizontal axis represents a value scale. The width of each bar is proportional to the value of each group. The wider the bar, the greater the value.
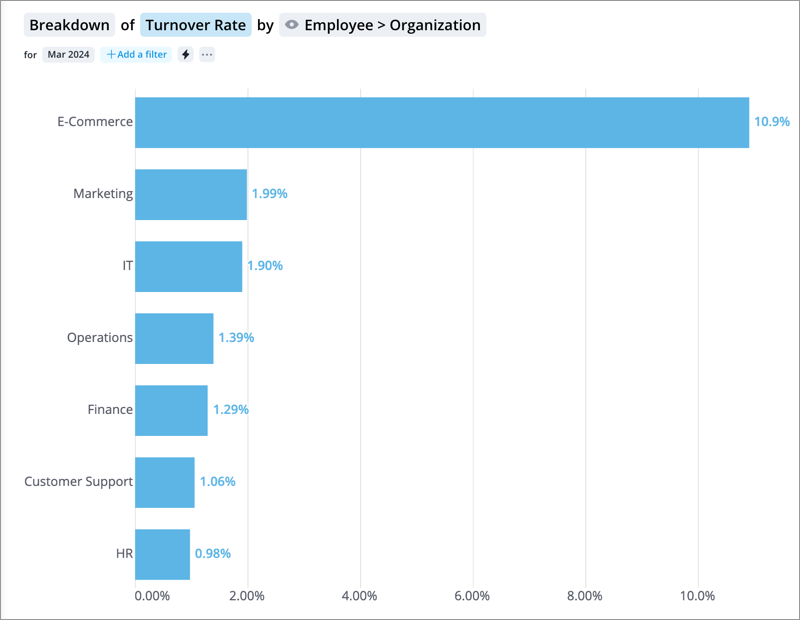
The Breakdown visual is easy to understand and provides a quick overview of the data. Use the chart to compare the number, frequency, or other measure of two or more related groups. For example, the Breakdown of Turnover Rate grouped by Organization Hierarchy is a good starting point for identifying potential retention issues in a company.
How to explore the visual to gain insight
- Sort the data in ascending or descending order in Chart Settings to answer questions like:
- Which group had the highest or lowest metric value during the period?
- What was the overall value of the metric during the period?
- View more details about a group in the Info panel by clicking the group.
- Drill down and explore other levels of the group by double-clicking the group.
- View data for a specific group of employees or analysis population by adding filters.
- Add additional metrics, groups, or time periods for comparison by clicking the Compare to button
 .
.
Tip:
-
Right-click on a chart item or data point to open the Visual Item Actions menu. Find actions that will allow you to quickly interact with points of interest. Actions include drilling up or down to view different levels of your data and accessing the Detailed View visual to see a list of subject members or event occurrences that make up a given population.
-
By default, zeros, null (N/A) values, and the Others data item are hidden.
-
To change the default settings, click your User icon
 > Preferences
  > Charts.
 -
In order for employee photos to appear in the visual the following criteria must be met:
Your organization has uploaded employee photos
The visual is grouped by Full Name
The height of the bars are 24 pixels or higher (The visual shows a maximum of 10 to 15 data items)
-
To hide employee photos, click Settings
on the Visual Actions menu, and then turn off the Show employee photos toggle.
Compare groups with a stacked bar chart
Tip: Watch this video to learn how to create a stacked bar chart.
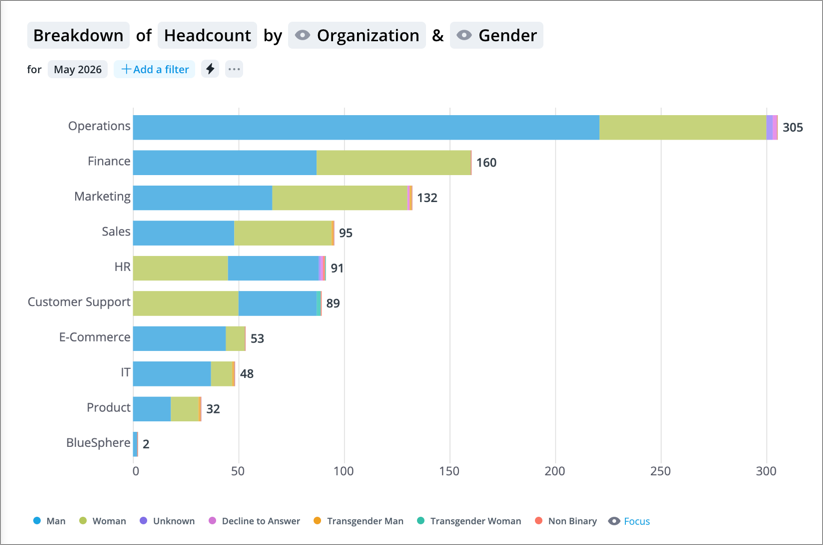
You can also convert the Breakdown visual to a stacked bar chart to compare different groups. In a stacked bar chart each bar represents a whole. It is divided into segments that represent different parts of that whole. The length of each bar is the total value of all the segments added together.
In a stacked bar chart, the metric is broken down by the primary group by attribute and then the secondary group by attribute. For example, in a Breakdown of Headcount grouped by Organization Hierarchy & Gender, the bars show the headcount for each organization and the bar segments show the headcount for each gender in the organization.
Note:
-
The stacked bar chart is only available for additive metrics whose values for different populations can be summed to calculate a total value for the combined population.
- Headcount is an additive metric because you can add the headcounts of Group A and Group B to calculate a total.
- Resignation rate is not an additive metric because you cannot add the resignation rates of Group A and Group B to calculate a total.
-
The stacked bar chart does not support a mix of positive and negative values. The visual will not display if the selected attributes produce stacked bars that contain positive and negative segments.
To create a stacked bar chart, in the visual title, on the right side of the primary grouping, click the Group the population button ![]() to add a secondary grouping.
to add a secondary grouping.
If you want to see the proportional differences between each group, you can use a 100% stacked bar chart. In this chart all the bars are equal to 100 percent and the segments represent the contribution of the secondary group by to the overall score. For example, in the Breakdown of Headcount grouped by Organization & Gender, the headcount is broken down by organization and the bar segments show the percentage contribution of each gender to the overall score for each organization.
To change the stacked bar chart to a 100% stacked bar, click the Settings button ![]() on the Visual Actions menu and then click 100% stacked bar under Breakdown options.
on the Visual Actions menu and then click 100% stacked bar under Breakdown options.
How data is organized in a stacked bar
The segments displayed in a stacked bar are determined by their overall value across the entire chart. Once the maximum number of displayable segments is reached, the remaining data is grouped into an Others segment. The displayed segments and the members that make up the Others segment remain the same across all bars. Segments within each bar are arranged according to the selected sort order.
Add traffic lighting rules
You can also highlight metric performance by applying traffic colors to the visual. For more information, see Traffic Lighting and Add Traffic Lighting Rules.