
Drivers Visual
Discover the groups that have the greatest impact on a specific metric.
The Drivers visual shows the groups in the organization that have the greatest influence in driving a particular metric up or down. This visual will help you discover which groups to focus on to make the largest business impact.
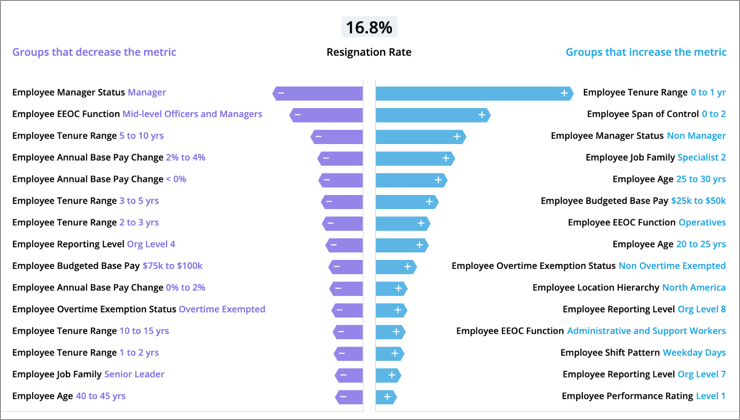
Each arrow on the visual represents a group, which is defined by a specific attribute such as Tenure or Job Family. Groups on the left decrease the overall metric value and groups on the right increase the overall metric value. The length of the arrow represents the magnitude of impact of that group. The groups are listed in descending order based on their drivers score, which is the extent to which they influence the overall metric. Groups that have the greatest positive or negative impact are listed first. For more information about the drivers score, see Calculation details for the drivers score.
Note: The groups on the left and right side are independent of each other.
Use the Drivers visual to identify groups that you can focus on when you want to drive a particular metric value up or down to achieve a desirable outcome.
How to explore the visual to gain insight
Once you've determined that you want to drive the overall metric value in a particular direction, you can consider different groups on either side of the Drivers visual to determine where you should focus your efforts. For example, let's say you want to lower the overall Resignation Rate of the organization and the visual shows:
- Employee Job Family: Specialist 2 as a group that increases the overall Resignation Rate.
- Employee Tenure Range: 5 to 10 years as a group that decreases the overall Resignation Rate.
You can focus your efforts on decreasing the Resignation Rate of employees with the Specialist 2 classification in an attempt to drive down the overall Resignation Rate. Alternatively, you can seek ways to decrease the Resignation Rate of employees who have a tenure between 5 to 10 years to further drive down the overall Resignation Rate.
You'll often need to conduct further analysis to determine the best course of action. Sometimes, you may not be able to address the needs of a high impact group, but you may be able to do something for a subpopulation of that group. You can drill into a group to get more details and understand why the group's metric value is so high or low. To drill down, select a group in the visual and then click Drill Down in the Insights tab of the Info panel. A filter is applied to the analysis context and you'll see the drivers for the selected group.
Try drilling through several groups and layers to find actionable items.
Tip: Right-click on a chart item or data point to open the Visual Item Actions menu. Find actions that will allow you to quickly interact with points of interest. Actions include drilling up or down to view different levels of your data and accessing the Detailed View visual to see a list of subject members or event occurrences that make up a given population.
Using the previous example, you may not be able to do something to directly target the Employee Job Family: Specialist 2 group. As a next step, you can drill into the group to see the drivers that influence the group's Resignation Rate. This essentially applies the same drivers analysis to the Specialist 2 group. From there, you may be able to identify a subgroup that you can target to drive the Resignation Rate for the Specialist 2 group down, which would also lead to a decrease in the overall Resignation Rate of the organization. You can also apply filters to the visual to achieve the same result and explore the drivers for different subgroups.
Ultimately, you want to use the insights gained from the Drivers visual to design programs that address the needs of specific employee groups in order to increase or decrease the group's metric value.
Calculation details for the drivers score
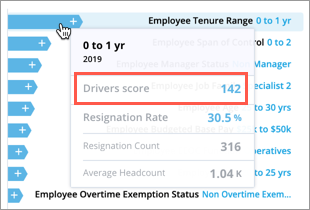
The drivers score measures the impact of a group on a metric. Hover over a group's name or arrow in the visual to see its drivers score.
To calculate the drivers score, we look at:
- How different a group performs compared to the overall population.
- The size of the group.
The drivers score is the difference between the group's metric value and the overall metric value multiplied by the group's average headcount. For example, the average headcount for the Employee Job Family: Specialist 2 group is 125. The Resignation Rate for the organization is 16.8% and the group's Resignation Rate is 35.2%.
The drivers score for the Employee Job Family: Specialist 2 group is calculated as follows:
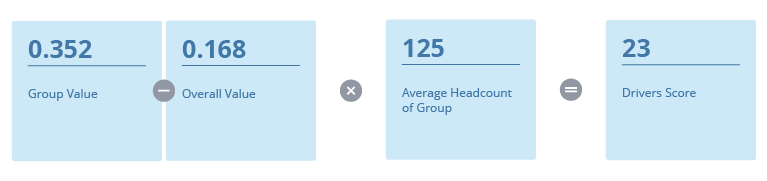
A large drivers score can be a result of a large difference between the group's value and the overall value, a large population size, or a combination of both.
Why do we look at the difference between the group and the overall population when determining its impact?
To calculate the drivers score, we use the value for the overall population as a reference point. Think of the overall value as an average. Values that are far away from other values in the data set tend to drive the average in a particular direction. For example, let's look at the following dataset: 25, 29, 30, 32, and 134. The average of these 5 numbers is 50 (196/5). You may have noticed that the value of 134 is very far away from the other values in the dataset. If we were to remove 134 from the dataset, the average would be 29 (116/4). As you can see this value drives the average up. So, if you could bring this number closer to the other values in the dataset, you can drive down the average. This means groups with a large difference have a higher potential of impacting the overall value when the group value is changed.
Why do we consider a group's size to determine its impact?
To calculate the drivers score, we use the value for the overall population as a reference point. Think of the overall value as an average. When calculating averages, large subpopulations will drive the average in a particular direction. For example, let's say we have 100 employees. 90 of them are between 25 and 35 years old and 10 of them are over 50 years old. The average age of employees is driven towards the 25 to 35 year range because the population contributing to that age range is large. This means groups with a large population have a higher potential of impacting the overall value when the group value is changed.
How to interpret the drivers score
The drivers score gives you an indication of the possible business impact you can make. A large positive or negative drivers score means the group has a high potential in influencing the metric value for the organization. The drivers score estimates, in absolute counts, what would happen if you were able to effectively change the group's metric value to match the overall metric value. In the previous example, the Employee Job Family: Specialist 2 group is a driver of Resignation Rate with a drivers score of 23. This means that the higher than average Resignation Rate for this group resulted in the resignation of 23 additional employees. By reducing the Resignation Rate of this group to the overall rate, you were able to avoid 23 resignations.
Frequently Asked Questions
What metrics does the Drivers visual support?
The Drivers visual supports most rates and ratios. You can see a list of the supported metrics by exporting the Application Definition from Studio. For more information, see Download the Application Definition.
When exporting the Application Definition, ensure that you've selected Metrics under Application Definition Content.
To see a list of the metrics supported by Drivers:
- Open the Metrics.xls file.
- In the Metrics sheet, click the Filter icon in the Driver Charts column header.
- Select the True checkboxes to display only the supported metrics.
Tip: If you do not have access to Studio, you can ask your system administrator for a copy of the Application Definition.
How is the list of drivers generated?
The attributes that are included in the Drivers calculation for each metric can be configured in Studio, as described in the next question.
Can I change the metrics or attributes supported by the Drivers visual?
Yes. Administrators can turn on Drivers support for rate or ratio metrics by doing the following:
- Open a project.
- On the navigation bar, click Model > Metrics.
- Select a metric from the list.
- Click Settings.
- Under Drivers visual, turn on the Supported by Drivers visual toggle.
To configure the Drivers attributes:
- In a rate or ratio metric, click Settings.
- Under Drivers visual, beside Included Hierarchies, click Edit.
- In the Included Hierarchies modal, select the attributes to include in the Drivers calculation.
- When finished, click Select.