
Sourcing Paths Visual
Explore the potential jobs that can be used to fill the target job.
Access requirements
Permission with these capabilities: Career Path & Sourcing Path Visualizations
Reach out to your administrator for access.
For more information about accessing this visual, see Configuration details.
Overview
Competing for talent in an external marketplace can be difficult and costly. In some cases it might make more sense for you to recruit internally. The Sourcing Paths visual will make sourcing easier and help you identify quality internal candidates for open positions. The visual is generated from the internal job histories and movement of your employees throughout your organization. By loading this data, you'll be able to select a target job and see the most common paths that employees took to that job. The visual can also be used in succession planning (sourcing for critical jobs), internal development (sourcing for highly specialized jobs), business transformation (sourcing for new jobs), and more.
Business questions that can be answered using the visual include:
- Where have I sourced internally for this role in the past?
- Who can we develop internally to fill a future role?
- Which jobs do we have trouble filling internally?
Note:
- If you want to explore career paths from the perspective of a specific employee, we recommend that you use the Career Paths visual. With the Career Paths visual, you can select an employee and navigate the various jobs they can have as they progress within your organization. For more information, see Career Paths Visual.
- Data security is not applied to the visual until a filter is added. After a filter is added, metric values and job transitions will be calculated for the population that a user has access to. For more information about how filters are applied, see Filter behavior.
Visier Community Sourcing Paths
Note:
- Additional Purchase This feature requires an additional cost. If you are interested, please contact your Customer/Partner Success Manager.
-
The dataset covers the period from January 2021 to December 2023.
By default, this visual will show you data from within your organization. Alternatively, you can also explore the data within the Visier Community, which is aggregated across Visier’s customers and can be used for benchmarking within your organization. Analyzing this broader data allows you to see a larger number of paths, so you can find suitable internal talent for a certain role outside of your conventional career progression.
To explore data in the Visier Community, select Visier Community and a Visier Occupation in the visual title.
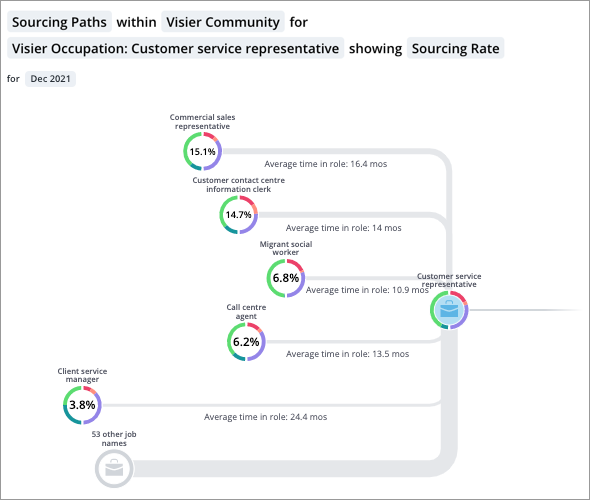
The data is aggregated, therefore the node values will show the Sourcing Rate displayed as percentages. The Sourcing Rate is calculated as the number of transitions from Job A to Job B divided by the sum of all transitions into Job B. The data is aggregated on a yearly granularity and annualized. Annualization takes the rate and calculates what it would be over a year. If you are analyzing a time period in between years, the calculation will be weighted towards the year that has more data points. For example, if your time period is Sept 2021 to Sept 2022, the calculation will be weighted towards 2022.
How to read the visual
The visual consists of nodes that represent different jobs within your organization.
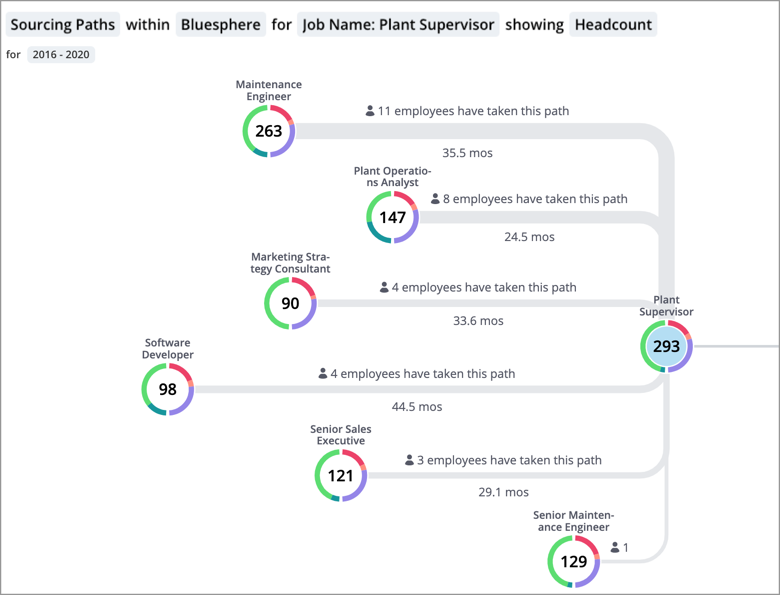
The selected target job is the central node that is connected to all other nodes in the visual. The job sources are located on the left side of the target job. In this example, the target job is Plant Supervisor. The Headcount is displayed at the center of each node and represents the number of active employees in the job, at the end of the period.
The jobs are connected by paths that indicate movement between jobs. The thickness of the path indicates the magnitude of the Transition Count, the total number of employees that have made the job move (from the source to the target job). The job sources are shown in descending order based on the Transition Count. The job source that appears at the top of the visual is the most common job that employees held before moving to the target job. In this example, the most common job that employees held before becoming a Plant Supervisor was Maintenance Engineer, a total of 11 employees made this transition during the selected period.
The distance between the job sources and the target job is based on the Average Time in Role, the average length of time employees stayed at a job before making the job transition. The length of the path indicates the magnitude of the Average Time in Role. On average, employees spent the most time at the job source that is located the farthest away from the target job. In this example, it took Software Developers longer to make the move to Plant Supervisor. The 4 Software Developers who made this move worked an average of 44.5 months before making the transition.
By default, you can use the following attributes to explore the visual:
- Job Name: The functions performed by the employee or requisition.
- Job Family: The group of jobs involving similar responsibilities and qualifications that the employee’s job belongs to.
- Lightcast Standard Job Name: The employee's standardized job name derived from the Lightcast data set.
- SOC Hierarchy: The standard hierarchical structure of occupational titles in the organization. This is based on a hybrid structure of the 2010 and 2018 Standard Occupational Classification (SOC) system and enriched with additional standardized occupations from Lightcast.
- Visier Occupation: Visier's occupation taxonomy that groups jobs into domains and sub-domains of occupational activity, which expands on ESCO (European Skills, Competences, Qualifications and Occupations) through enrichment with additional standardized occupations.
Changing the selected attribute in visual title allows you to view the paths in terms of internal job names or job families. Job names are often too detailed, with too many unique values. Using job families is a good way to get a smaller number of values and will help you better understand the job description and the skills that are needed so you and your employees can make better hiring and career development decisions.
Administrators can change the dimensions that are available for this visual. For instructions, see Configure Visuals.
How to explore the visual to gain insight
- Select the target job that you want to source for in the visual title.
- Add filters to view data for a specific group of employees or analysis population.
- Select the time period for analysis. The time period determines the amount of movement data you want to look at for your analysis. Do you want to base your analysis on employee movement across all time or do you only care about recent employee movement, which may be more relevant to your use case.
- Hover over a path to see data tips for the job transition.
- Transition Count: The total number of employees that have made the job move at the end of the period. A high transition count may indicate a potential feeder job where you've historically promoted or transferred employees from.
- Average Time in Role: The average length of time employees stayed at a job before making a job transition during the period. A longer Average Time in Role may indicate that the skills required for one job cannot be easily transferred to the target job.
- Hover over a job source to see a summary of the employee movement for the job.
- View a list of potential candidates by selecting a job source. Then in the Info panel, click View details to see the employees who have the selected job.
- View a list of employees who may be able to provide more insight about the job transition by selecting a path. Then in the Info panel, click View details to see the employees who have made the selected move.
- Explore additional sources by looking at the sources of a job source. Make the job source the target job by double-clicking the job source or selecting the job source and clicking Explore Source in the Insights tab of the Info panel. Quickly use the breadcrumbs in the lower-left corner of the visual to navigate the paths.
Tip:
Right-click on a chart item or data point to open the Visual Item Actions menu. Find actions that will allow you to quickly interact with points of interest. Actions include drilling up or down to view different levels of your data and accessing the Detailed View visual to see a list of subject members or event occurrences that make up a given population.
About Detailed View
To provide users with accurate information about the jobs and paths within an organization, the visual is presented without security restrictions when there are no filters applied. This means that all users will see the same data and paths. However, the data that is available in the Detailed View visual is restricted by the user's security access. As a result, users may see a difference between the Transition Count or Headcount and the number of employees listed in Detailed View.
Filter behavior
If the employee meets the filter criteria at any point during the selected time period, they will be included in the transition count. This may lead to discrepancies when comparing the number of records in the Detailed View visual and the number of transitions made. Detailed View will only show records for employees who meet the filter criteria at the end of the selected period.
Consider the job histories of employees who moved from Customer Support Specialist to Sales Coordinator:
| Employee | Customer Support Specialist | Sales Coordinator |
|---|---|---|
| A | 2018, located in the United States | 2020, located in Canada |
| B | 2016, located in Canada | 2019, located in the United States |
| C | 2021, located in Canada | 2022, located in Canada |
| D | 2014, located in the United States | 2018, located in the United States |
Let's say you're looking at job transitions from January 2013 to December 2022 and you've applied a filter for the United States to the visual. You'll see the following information:
- Employee A is included in the job transition from Customer Support Specialist to Sales Coordinator. Employee A is included in the Customer Support node in Detailed View.
- Employee B is included in the job transition from Customer Support Specialist to Sales Coordinator. Employee B will be included in the Sales Coordinator node in Detailed View.
- Employee C is excluded from the visual because they don't meet the filter criteria at any point during the selected time period. They remained in Canada.
- Employee D is included in the job transition from Customer Support Specialist to Sales Coordinator. Employee D is included in the Customer Support Specialist and Sales Coordinator nodes in Detailed View.
Configuration details
The following objects must be configured for this visual to appear and work correctly. Contact your administrator if the visual is not appearing correctly.
Data must be loaded and configured for:
- Employment Start event (Employment_Start)
- Employee Exit event (Employee_Exit)
- Job Name dimension (Job_Name)
- Optional: Job Family dimension (Job_Family)
Note: The Career Movement concept (careerMovement) must be configured to use the Job Name or Job Family dimension to track moves in/out and moves within.
Users must have aggregate data access to:
- All properties of the Employee Start event
- All properties of the Employee Exit event
- Job Name property of the Employee subject
- Optional: Job Family property of the Employee subject
Add the following metric to each child tenant's custom module to make the visual available:
- Career Internal Movement Count (careerInternalMovementInCount)