
How Data is Organized in the Table Visual
Learn how the combination of time, metrics, and groups are organized in rows and columns.
Overview
Depending on how you want to analyze your data, you can organize the Table visual in a nested or flattened structure.
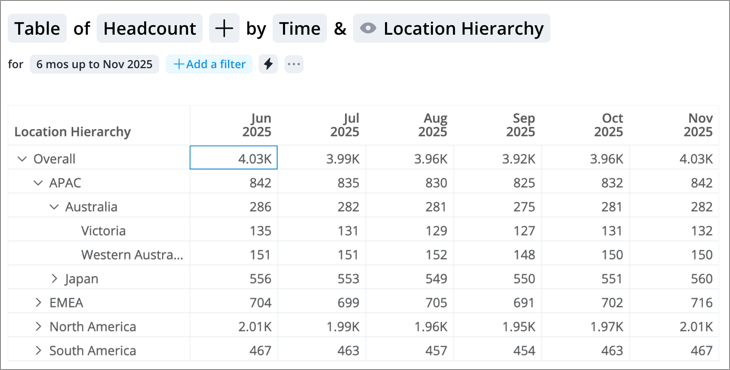
With a nested structure data is organized vertically in a hierarchical layout, where related items are grouped under parent rows. Indentation is used to show relationships between levels, allowing you to expand or collapse groups to reveal or hide detail.
With a flattened structure data is organized horizontally in a single-level layout, where related items are displayed side-by-side. Separate columns are used to represent hierarchical levels rather than indentation, allowing you to view all data at once in a format similar to a standard spreadsheet.
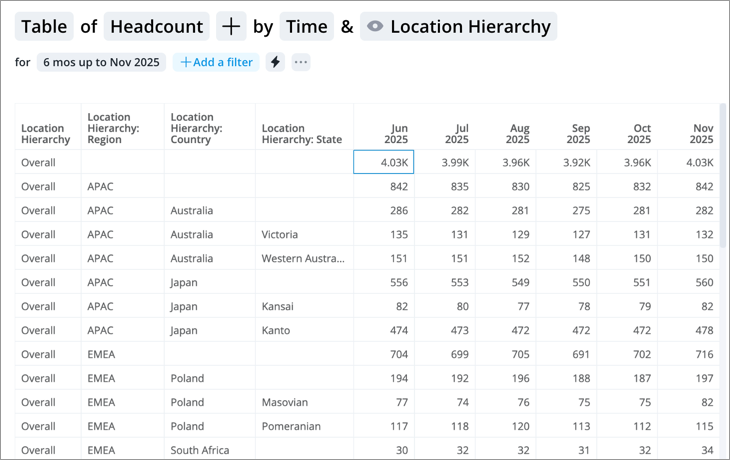
The nested structure is best for visualizing hierarchical data and seeing how values roll up into parent categories. The flat structure is best for scanning, sorting, and comparing data across groups. For instructions on how to change your table from a nested to a flattened structure, see Flatten the table structure.
What happens when you have time, metrics, and groups as rows
Rows can contain a combination of time, metrics, and groups. Rows will be arranged based on the following structure:
- Time
- Groups
- Metrics
This means the data will be organized in rows by time periods, attribute values, and then metrics.
Example: Table with metrics and groups as rows
You have a Table showing Open Requisitions and Headcount with the following structure:
- Time as columns
- Groups as rows in the following order:
- Organization
- Metrics as rows in the following order:
- Open Requisitions
- Current Applicants
| Q1 2016 | |
|---|---|
| Marketing | |
| Open Requisitions | 76 |
| Current Applicants | 324 |
| Product | |
| Open Requisitions | 18 |
| Current Applicants | 406 |
How hierarchical data is organized in a nested structure
You can add up to 4 groups as rows to create a table with different levels or nested data that you can expand or collapse.
The following table shows the structure when 3 groups have been added as rows:
- Organization
- Tenure
- Gender
| Q1 2016 | |
|---|---|
| Marketing | |
| 1 to 2 yrs | |
| Man | |
| Woman | |
| 0 to 1 yr | |
| Man | |
| Woman | |
| Product | |
| 1 to 2 yrs | |
| Man | |
| Woman | |
| 0 to 1 yr | |
| Man | |
| Woman |
As you go down each level, you'll see greater detail:
- The first level contains data grouped by Organization (for example, Headcount for Marketing).
- The second level contains data grouped by Organization and Tenure (for example, Headcount for employees in Marketing with 1 to 2 years of tenure.
- The third level contains data grouped by Organization, Tenure, and Gender (for example, Headcount for employees who are women in Marketing with 1 to 2 years of tenure).
Reorder groups and metrics
- In the Table settings panel, click the Move button
 for the item you want to move and drag the item to the desired position.
Metrics and groups are arranged in the order they appear in the Table settings panel. In columns, the metric at the top of the list will appear in the leftmost column and the metric at the bottom of the list will appear in the rightmost column. In rows, the metric at the top of the list will appear at the top of the table and the metric at the bottom of the list will appear at the bottom of the table.
Note: Custom time periods are arranged in the order that they are added and cannot be reordered.
Hide zeros and null (N/A) values
You can hide rows that contain zeros or null values in the Chart settings panel by clicking the Settings button ![]() . For more information, see Show or Hide Data Items.
. For more information, see Show or Hide Data Items.
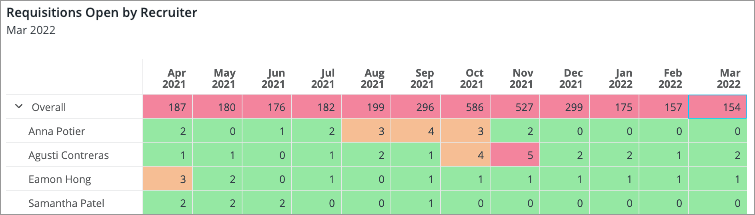
Hide overall values
You can hide the overall row or column in a table. This is helpful in scenarios where the overall values are not meaningful, such as applying traffic lighting to additive metrics. For example, let's say you created a table that shows Requisitions Open by Recruiter. You apply the following traffic lighting rule: Metric value is greater than 5, traffic light as Bad. In this example, the entire overall row in the table will show as red because the metric is additive, as shown in the screenshot below.
This is visually misleading because the traffic light rule applies only to each employee individually and should not include overall. In this case, we can hide the overall row for more accurate representation in the table, as shown in the screenshot below.
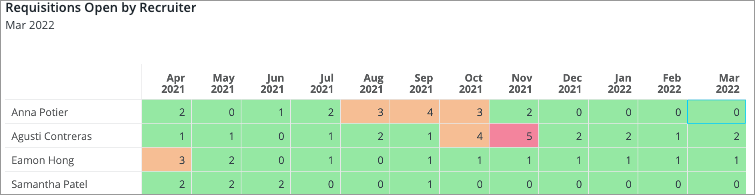
To hide the overall row or column:
-
Click the Settings button
 on the Visual Actions menu.
 - In the Settings panel, under Table options, turn off the Show overall toggle.