
Use Visier Data in Power BI
Create reports in Power BI by fetching data from Visier.
Overview
If you want to use your Visier data in Power BI Desktop, you can use Visier's Power BI plugin to fetch aggregate and table data from Visier to create reports in Power BI. Visier users with the appropriate data security access can get data out of Visier to use in Power BI.
Note: Cast your vote and help get the Visier Connector certified with Power BI
Support our efforts to get our Power BI connector certified by Microsoft. This will allow the connector to be distributed directly and eliminate the need for manual downloads and registrations with each new version. Upvote this idea on the Fabric Community to show your support.
Prerequisites
- Have a Visier tenant that contains data.
- Have a Viser user account. You can log in with your username and password or single sign-on (SSO) if your organization uses SSO.
- Have access to data in Visier. You can only bring Visier data into Power BI if your Visier user account is assigned data security access to that data. For more information about data security in Visier, see Data Security.
- Do one of:
- Download the VisierDataConnectorSigned.pqx file and register the certificate thumbprint. The PQX file allows you to connect to Visier from Power BI by registering Visier as a trusted third-party connector. To register the certificate, use this thumbprint: EF699900397E9555F468B8C8267A83080A6996D8. For more information, see Trusted third-party connectors. If you're able to edit your registry, we recommend this method.
- Download the VisierDataConnector.mez file. The MEZ file allows you to connect to Visier from Power BI without editing your registry.
For more information about the latest PQX and MEZ files, see File history.
Note: An API key i s no longer required. If you receive an API key error, contact Visier Technical Support for help with migration.
Connect Visier data to Power BI
After completing the prerequisites, you're ready to connect your data to Power BI. You must first move the PQX or MEZ file into your Power BI application folder. If using the MEZ file, there is an additional step to allow Power BI to open the extension.
Step One: Move the Visier data connector file into Power BI
- On your local device, find your Power BI application folder; for example, YourHome\Documents\Power BI Desktop.
- In the Power BI Desktop folder, open the Custom Connectors folder.
- In the Custom Connectors folder, paste the VisierDataConnectorSigned.pqx or VisierDataConnector.mez file.
Step Two: Allow Power BI to open the VisierDataConnector extension
Note: If using the PQX file, you can skip this step.
- On your local device, launch Power BI Desktop.
- In Power BI, click File > Options and settings > Options > Security.
- In Security, under Data Extensions, select (Not Recommended) Allow any extension to load without validation or warning.
Note: Visier is not yet certified with Power BI. If you do not select this option, you cannot load Visier data into Power BI using the MEZ file.
- To apply your change, click OK.
- Restart Power BI Desktop.
Step Three: Authorize Visier access in Power BI
- On your local device, launch Power BI Desktop.
- In Power BI, click File > Get data > Get data to get started.
- In the Get Data dialog, in the search bar, type Visier and then click VisierDataConnector (Beta).
- Click Connect.
- In the Visier Data Connector dialog, provide the vanity name in your Visier URL; for example, if your Visier URL is jupiter.visier.com, your tenant vanity name is jupiter.
- Optional: Select a login method:
- OAuth 2.0 is the default.
- If your organization uses single sign-on (SSO) to log into Visier and you have access to a user account that bypasses SSO, select the Non-SSO login option. For more information about setting up Bypass Users, see Set Up Single Sign-On.
- If you are publishing the report with Visier data to the Power BI Service and scheduling data refreshes, select the Direct Username-Password option. This enables credential caching so you don't have to re-authenticate for data refresh.
- After providing your credentials, click OK.
- Click Sign In.
- On the Visier sign in page, provide your user credentials (username and password or SSO) and then click Sign In.
- Click Connect.
Result: If successful, Power BI launches the Navigator dialog. In the Navigator dialog, you can select data from your Visier solution.
Create reports in Power BI
Tip: Get started with Power BI reports
- To see what a report looks like with sample data, download the Visier Power BI Sample Report.
- To start building a report, download the Visier Power BI Report Template. To load your data, authenticate with your Visier tenant credentials. For more information, see Create and use report templates in Power BI Desktop.
- Watch this video for a demo of the Power BI plugin.
Now that your Visier data is accessible in Power BI, you can create reports in Power BI powered by Visier data. This section describes how to access Visier data using Power BI's Navigator and some of the settings you can use to create meaningful data visualizations. This article doesn't describe every action you can take to visualize data in Power BI. For more information about using Power BI, see Create reports and dashboards in Power BI - documentation.
Select a metric or list of records
The Navigator dialog contains a list of every analytic object that your Visier user can access; for example, Employee and Employee Exit. If you expand an object, you can then select its Metrics or Records, or form a query, as described next.
- Metrics: All metrics associated with the object. For example, if you select Employee, you can then select a metric like Headcount or Absence Ratio.
- Records: A list of members associated with the object. For example, if you select Employee, you can then select snapshot.
- JSON Aggregate query: A single-line JSON query to retrieve aggregate data for the analytic object. For more information about JSON aggregate queries, see JSON query code samples.
- JSON Snapshot query: A single-line JSON query to retrieve snapshot data for the analytic object. For more information about JSON snapshot queries, see JSON query code samples.
- Multi-Metric query: More than one metric from which to retrieve data for the analytic object.
Set the analysis context
After you select a metric or snapshot, you can then set the analysis context for your visualization.
If you selected a metric or multi-metric query, you can set the following options.
- Metrics: If you selected Multi-Metric query, select one or more metrics from the list.
- Time period count: The number of time periods to retrieve, such as 6 months.
- Time period type (optional): The type of time period to measure data, such as MONTH or QUARTER. If undefined, the default is YEAR.
- Date type: Select a method to specify the time instant to query from.
- Update automatically (Complete & Non-complete periods): If Time direction is BACKWARD, use the start of the most recent period. If Time direction is FORWARD, use the start of the earliest period.
- Update automatically (Complete periods): If Time direction is BACKWARD, use the start of the most recent complete period. If Time direction is FORWARD, use the start of the earliest complete period.
- Use specified value in Date field: Use the date from which to retrieve data as defined in the Date field.
- Date (optional): The date from which to retrieve data. Required if Date type is Use specified value in Date field. Otherwise, leave empty.
- Time direction (optional): The direction to return data, such as BACKWARD. If undefined, the default is BACKWARD.
- Trailing period count (optional): The number of trailing time periods to retrieve, such as 6 months. Trailing period is only relevant for time-based metrics such as rates. If undefined but the trailing period type is defined, the default is 1.
- Trailing period type (optional): The type of trailing period to measure data, such as MONTH or QUARTER. Trailing period is only relevant for time-based metrics such as rates. If undefined but the trailing period count is defined, the default is MONTH.
- Filter by (optional): The attribute to filter the data by.
- Group by (optional): The attribute to group the data by.
If you selected a snapshot, you can set the following options.
- Properties: The attribute to retrieve data for.
- Sort by (optional): The attribute to sort the data by.
- Sort order (optional): Whether to sort results in ascending or descending order. If undefined, the default is SORT_ASCENDING.
- Date type: Select a method to specify the time instant to query from.
- Update automatically (Complete & Non-complete periods): If Time direction is BACKWARD, use the start of the most recent period. If Time direction is FORWARD, use the start of the earliest period.
- Update automatically (Complete periods): If Time direction is BACKWARD, use the start of the most recent complete period. If Time direction is FORWARD, use the start of the earliest complete period.
- Use specified value in Date field: Use the date from which to retrieve data as defined in the Date field.
- Date (optional): The date from which to retrieve data. Required if Date type is Use specified value in Date field. Otherwise, leave empty.
- Time period type (optional): The type of time period to measure data, such as MONTH or QUARTER. If undefined, the default is YEAR.
- Time period count: The number of time periods to retrieve, such as 6 months.
- Time direction (optional): The direction to return data, such as BACKWARD. If undefined, the default is BACKWARD.
If you selected a JSON query, paste a single-line JSON query. For more information, see JSON query code samples.
When finished, click Apply. Power BI generates a data preview based on the defined analysis context. If the data preview looks good to you, click Load.
Adjust the data settings
Now that you have data in Power BI, you can configure the data settings to change the representation of data. For example, you can rename the metric or select the Date Hierarchy type. The following steps are a few options you can do to adjust the data settings. For more information about the Data pane, see Work with Data view in Power BI Desktop.
- In the Data pane, expand the metric or snapshot.
- Optional: Expand DateInRange > Date Hierarchy and then select the Date Hierarchy type, such as MONTH.
- Optional: If you selected a metric, beside Measures, click the More options button
 > Rename. You can then type a new name for the selected metric.
 - Optional: If you defined any filters or group bys, rename them by clicking the More options button > Rename.
Build a visualization
With the data settings configured, you can now build your visualization with the data. The following steps are a few options you can do to build your visualization. For more information about visuals, see Visualizations in Power BI reports.
- In the Visualizations pane, select a visual type, such as a pie chart.
- In the Data pane, drag the group by (if available) to the Visualizations pane under Y-axis.
- In the Data pane, drag the metric to the Visualizations pane under X-axis.
- To hide zeros from the visual, do the following:
- In the Data pane, drag the metric to the Filters pane.
- Expand the metric.
- Change Show items when the value to Is greater than and 0.
- When finished, click Apply filter.
Save or publish your work
When finished building your report, you can save it to your local device or publish it to the web server. Either of these options retain the data at the time that you built the report. For more information, see Export reports from Power BI to PDF or Publish to web from Power BI.
Tip: To refresh your Visier data in Power BI, the next time you launch Power BI after your first session using Visier data, click Refresh Now on the pop-up banner.
Connect to Power BI Service
After creating a report in Power BI Desktop, you can optionally publish the report to Power BI Service. If you publish the report to Power BI Service, you can manually refresh your report's data or schedule data refreshes on a daily or weekly basis.
To connect to Power BI Service:
- Install an on-premises data gateway. We recommend a standard gateway, but if your user doesn't have admin access, you can install a personal mode gateway. For more information, see Install an on-premises data gateway.
-
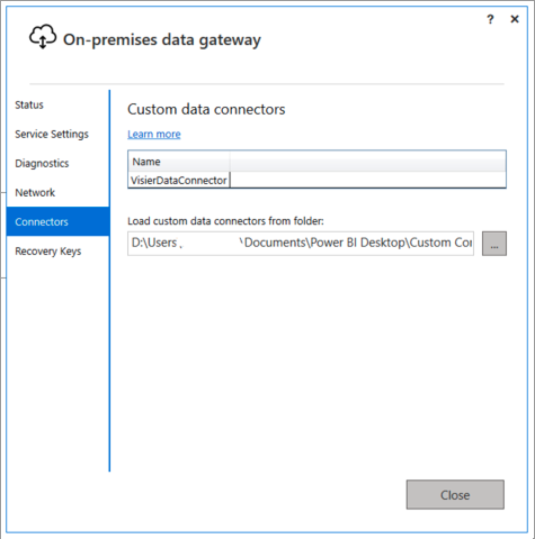
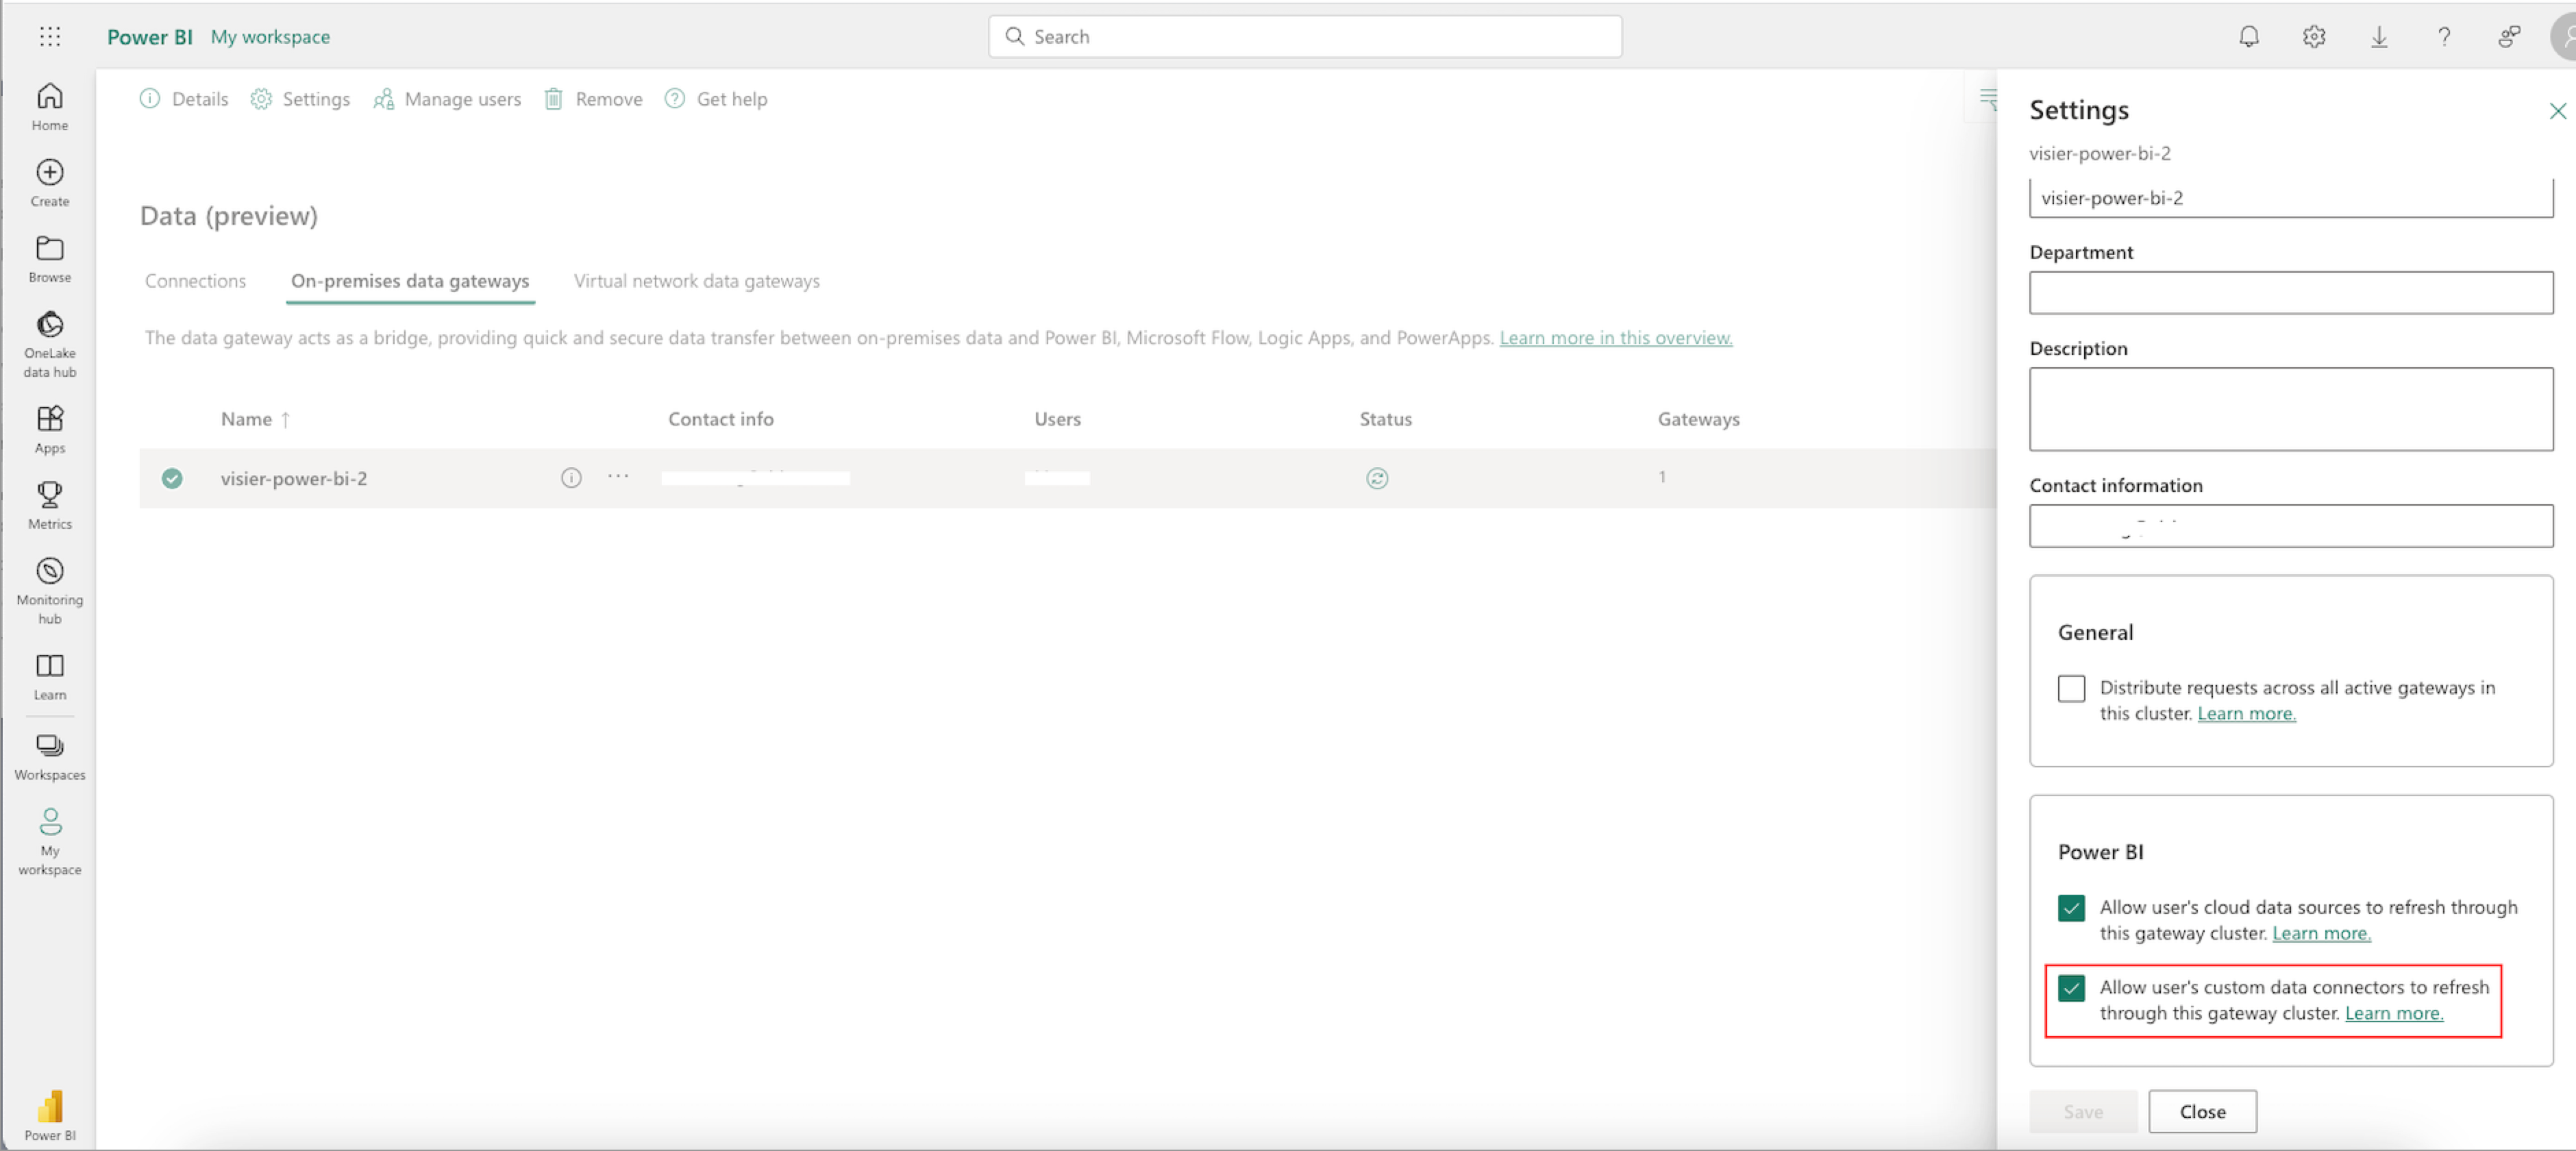
After the gateway is installed, set up the gateway cluster to use Visier's custom connector, as shown next. The gateway's service user must have access to your Power BI Custom Connector's folder. For more information, see Use custom data connectors with an on-premises data gateway.
-
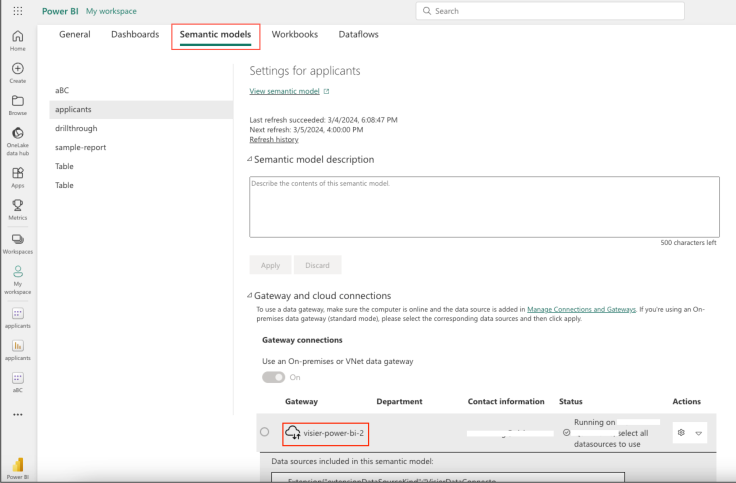
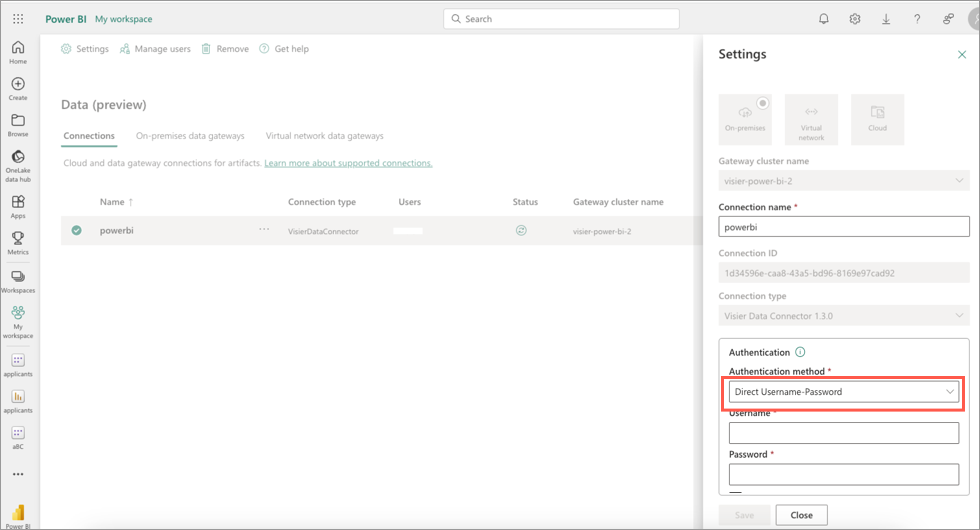
In your report in Power BI Service, navigate to Semantic models and schedule daily or weekly data refresh, using the established connection as shown next. Ensure, the Direct Username-Password option is selected as the Authentication method.
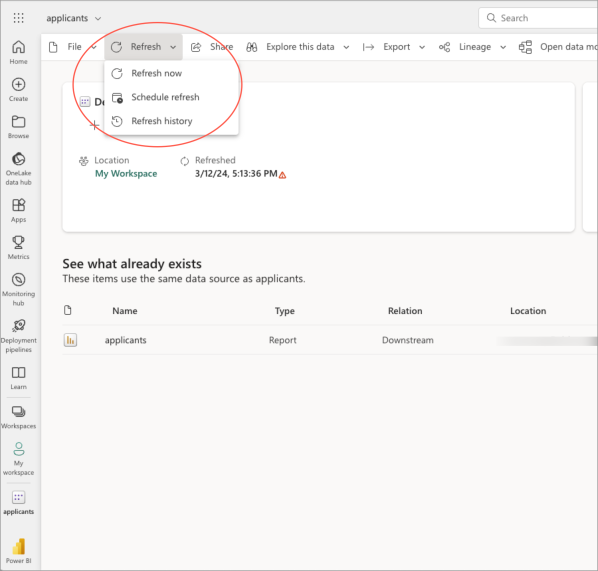
- Optional: To manually refresh your data in Power BI Service, click Refresh > Refresh now.
Troubleshooting
If you run into errors with Visier's Power BI plugin, try the following troubleshooting methods.
|
Error message |
Troubleshooting method |
|---|---|
|
"We're unable to connect. Please delete your credentials and try again later." "The remote name could not be resolved: {url}" "Cannot begin authentication at {url}" "We couldn't authenticate with the credentials provided. Please try again." |
|
|
"Aggregate or Snapshot query returned empty results for the selected options. Please modify options and try again." |
There may not be any data in the selected time range. Modify the selected date or time period count and then load the query again. |
|
"Value cannot be null. Parameter name: uriString" |
If the authentication window for Power BI can't open, you can use your default web browser to authenticate.
|
|
"Failed to save modifications to the server. Error returned: The provider ‘Microsoft.PowerBI.OleDb' is not registered. The following system error occurred: Class not registered." |
If you get this error during authentication:
|
|
VisierDataConnector is not available as a data source in the Get Data dialog. |
Method: Rename the Power BI application folders Power BI fails to locate the data connector file as it expects it to be in a folder with the following path: Power BI Desktop\Custom Connectors.
Method: Update PQX file certificate The certificate for the PQX file has expired. You will need to download the latest version and move it into your Power BI application folder. Then, update the certificate thumbprint in the Windows Registry.
|
|
When refreshing the report, you get the following error message: "The import matches no exports. Did you miss a module reference?" |
The certificate for the PQX file has expired. You will need to download the latest version and move it into your Power BI application folder. Then, update the certificate thumbprint in the Windows Registry.
|
If the above methods aren't applicable to you, check your log messages in Power BI, as described next.
- On your local device, launch Power BI Desktop as Administrator.
- In Power BI, click File > Options and settings > Options > Diagnostics > Enable tracing.
- Click OK.
- In Power BI, reproduce the error that you ran into previously. For example, if you ran into an error during authentication, go through the authentication steps again to make the error occur again.
- In Power BI, click File > Options and settings > Options > Diagnostics > Open crash dump/traces folder.
- In the folder, find the latest modified Microsoft.Mashup.Container.NetFX45... file.
- Download the file to your local device.
- Send the file to Visier for further investigation. You can send the file to Visier by filing a support case.
JSON query code samples
Selection of code samples that demonstrate the use of the JSON query builder. Copy and edit these code samples to suit your needs. For more samples, see Visier's Data Query API Code Samples.
Note: Power BI doesn't support multi-line JSON queries. Before pasting your query into Power BI, convert it to single-line format. You can convert JSON with an online tool such as JSON Formatter.
Aggregate query
This sample query loads 3 months of data for Average Direct Span of Control and Headcount filtered by Able to Remote Work employees backwards from January 1, 2023. The data is grouped by Absence Hours.
{
"query": {
"source": {
"metrics": {
"columns": [
{
"id": "wfaStructureSpanOfControlMeasure",
"columnName": "Average Direct Span of Control"
},
{
"id": "employeeCount",
"columnName": "Headcount"
}
]
}
},
"axes": [
{
"dimensionLevelSelection": {
"dimension": {
"name": "Employee.Absence_Hours",
"qualifyingPath": "Employee"
},
"levelIds": [
"Employee.Absence_Hours_level"
]
}
}
],
"filters": [
{
"selectionConcept": {
"name": "ableToRemoteWork",
"qualifyingPath": "Employee"
}
}
],
"timeIntervals": {
"fromDateTime": "2023-01-01T00:00:00.000",
"intervalPeriodType": "MONTH",
"intervalPeriodCount": 1,
"intervalCount": 3
}
}
}Snapshot query
This sample query loads 3 months of employee exit data backwards from January 1, 2023. Properties loaded include the employee ID of the employee who exited the organization, their age, and the effective date. The data is sorted in descending order by the Effective Date column.
{
"source": {
"analyticObject": "Employee_Exit"
},
"columns": [
{
"columnName": "Employee age",
"columnDefinition": {
"property": {
"name": "Employee.Age",
"qualifyingPath": "Employee"
}
}
},
{
"columnName": "Employee ID",
"columnDefinition": {
"property": {
"name": "Employee.EmployeeID",
"qualifyingPath": "Employee"
}
}
},
{
"columnName": "Effective Date",
"columnDefinition": {
"effectiveDateProperty": {}
}
}
],
"sortOptions": [
{"columnIndex": 2, "sortDirection": "SORT_DESCENDING"}
],
"timeIntervals": {
"fromInstant": "1672531200000",
"intervalPeriodType": "MONTH",
"intervalPeriodCount": 1,
"intervalCount": 3
}
}File history
Download the VisierDataConnectorSigned.pqx file.
Download the VisierDataConnector.mez file.
|
Version |
Last updated date |
Changes |
|---|---|---|
|
1.8.0 |
June 10, 2026 |
|
|
1.7.6 |
May 29, 2026 |
|
|
1.7.5 |
November 21, 2025 |
|
|
1.7.4 |
June 25, 2025 |
|
|
1.7.3 |
February 5, 2025 |
|
|
1.7.2 |
January 15, 2025 |
|
|
1.7.1 |
November 23, 2024 |
|
|
1.7.0 |
September 4, 2024 |
|
|
1.6.0 |
June 12, 2024 |
|
|
1.5.0 |
May 1, 2024 |
|
|
1.4.0 |
March 13, 2024 |
|
|
1.3.0 |
February 21, 2024 |
|
|
1.2.0 |
December 13, 2023 |
|
|
1.1.0 |
November 22, 2023 |
|
|
1.0.0 |
October 25, 2023 |
|
|
0.9.0 |
September 28, 2023 |
|
|
0.8.0 |
August 18, 2023 |
|