
Objects in Visier
The objects in Visier allow users to create analyses and answer critical business questions.
Objects are created, customized, and configured in Studio to create your own solution. Gain a high-level understanding of Visier's objects before getting started with more in-depth creation and configuration topics.
Analysis
Analyses combine several analytic elements to answer complex business questions through showing relevant insights. These elements include the analysis context, business question, text, charts, visual titles, and links to other analyses. The analysis context, such as time period and filters, is set by the topic level, but can be modified within each chart during ad hoc exploration. This change is not retained after you return to the topic.
Example:
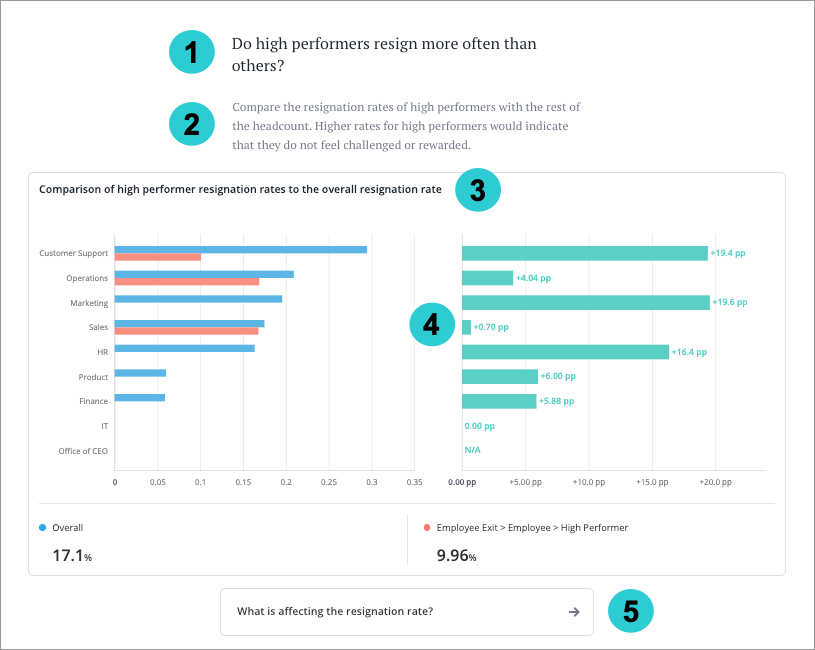
- Business question: A specific business concern that can be addressed using analytics.
- Text: A brief overview of the business question and associated chart.
- Title: A descriptive name for the visualization.
- Chart: A visualization of the business question using metrics.
- Link: A related analysis.
Analytic object
Analytic objects are the various items that users are able to analyze in your solution. These are useful for organizing and grouping specific populations to perform calculations and identify trends in your data.
Event
An event represents an incident at a specific point in time that occurred to a subject. Events have properties, but the details of an event do not change after occurring. Use events to identify one-time changes in your data.
Example:
An Interview is an event that occurs at a point in time and is associated with an Employee subject (the interviewer) and an Applicant subject (the interviewee). Properties on an Interview event include interview type and outcome.
Internal Comparison
An internal comparison allows you to understand how you perform against other groups in your organization. Internal comparisons show you an aggregate view of larger populations that you normally don't have data access to so your organization can share information to help make the right decisions.
Example:
Employee Internal Comparison is a collection of metrics and dimensions used to create comparisons within your organization on the Employee subject. You can use Employee Internal Comparison to compare metrics like Resignation Rate for your team against the resignation rate of your peers, your manager’s team, or your entire organization.
Overlay
An overlay represents a collection of values. Overlays are data structures with a fixed set of dimensions by which the stored values are indexed, grouped, and filtered. Often overlays are used to store aggregate values and are intended to show the breakdown of a metric with respect to one or more dimensions.
Example:
Overlays such as benchmarks are collections of aggregated metrics that are loaded from governments or third parties. A Salary benchmark does not identify the salary of each individual, but consists of the average salary values for specific segments of the population.
Subject
Subjects are entities, or separate and independent things, that evolve over time. They have attributes and changes to those attributes are captured over time. Use subjects to identify specific content items that exist in your organization's data.
Example:
An Employee is a subject with attributes such as birth date, direct manager, and gender. When an employee's manager changes, that change to the subject's Direct Manager attribute is captured.
Property
Properties are qualities of an analytic object. Use properties to add further detail to your data.
Example:
- Birthdate, Location, and Tenure are properties of the Employee subject.
- Hire Date, Hire Type, and Time to Hire are properties of the Employee Start event.
Calculated property
A calculated property takes a value that comes directly from the data and expression. It provides a value calculated for a given subject member.
Example:
Tenure is a calculated property that takes the simple property Hire Date and has an expression: time from Latest Time to Hire Date.
Multi-value property
Multi-value properties (MVPs) are a collection of simple properties that describe a single attribute that can have several values valid at the same time. MVPs allow you to add more descriptive data to properties.
Example:
- Education is a multi-value property containing a collection of simple properties that identify the year, school, and diploma or certificate achieved. It is modeled as a list because an employee’s education can include more than one diploma or degree.
- Employee Budgeted Compensation is a multi-value property that has many parts like salary and bonus. These property values can change frequently, so each row of the MVP has a validity interval.
Simple property
A simple property provides single-level detail to an analytic object. The value of a simple property can change.
Example:
An employee’s Job Name property correlates to one value that is subject to change when the employee changes positions within the organization.
Subject reference
Subject references are special properties defining links between objects by connecting a subject or event to a subject. This allows members of the same subject to link to one another via a forward or reverse reference, providing an additional layer of detail for the relationship between objects. A forward reference establishes a many-to-one relationship between objects, while a reverse reference is the inverse of this relationship.
Example:
The subject reference "Works on" is attached to the Employee subject and has values for one or more Account IDs that specify the accounts an employee has worked on. Each Account ID has a forward subject reference to the Employee subject member, while the employee has reverse references to each of the Account IDs.
Concept
Concepts are content objects that are used to define model content and business processes independent of data. A concept is conceived in the mind, an idea, and not based on any physical object. Concepts are used to standardize information, such as defining employee movement in the organization or diversity factors.
Example:
Gender is an idea that can have different values across multiple source systems, such as man and woman, 0 and 1, M and F, among others. Using Visier, a concept for Woman is created and used to define content. Data is later associated with or mapped to the Woman concept to specify that all genders mapped to it are considered women.
Calculation concept
Calculation concepts are used to describe a hierarchical relationship between calculations. This type of concept supports aggregation in the hierarchy where the child members are summed up to their parent (for example, Parent A = Child B + Child C). This does not work for other calculation hierarchies where subtraction is used (for example, Parent A = Child B − Child C) or other operations, such as multiplication and division.
Example:
Total Cost of Workforce is a calculation concept. Within this concept, the parent member Direct Compensation is summed from child members Base Pay, Variable Pay, Supplemental Pay, and Long Term Incentive.
Movement concept
The movement concept defines the properties that are thought of as "movement" when their value changes for a subject member. This allows you to better analyze subject movement in your organization. A movement concept defines the subjects, dimensions, and metrics associated with movement.
Example:
Employee Movement is a movement concept that defines changes to the properties Location or Organization on an Employee subject as movement. Movement is captured in the Internal Movement and Internal Move Count metrics.
Process concept
Process concepts describe the steps or stages that a subject goes through. This concept provides the ability to define subjects, dimensions, date properties, stages, outcomes, and metrics for each process.
Example:
The Applicant Process is a process concept that defines the stages an Applicant subject will go through before ending in a final state, such as Hired Yet to Start.
Selection concept
Selection concepts select a population of subject members of a given subject or event. This concept is defined by member selection or calculation. If the object is defined based on a shared dimension or another selection concept, it can technically return multiple populations of subject members of different subjects.
Example:
HR Employee is a selection concept that selects a population of subject members defined by the Job Name dimension. It defines the Job Name subject members HR Business Partner, Senior Recruiter, Chief Human Resources Officer, etc. as the HR Employee population.
Calculated selection concept
A calculated selection concept is used to identify a specific cohort using Visier Formula Language (VFL). This has the functionality of a member selection concept and range dimension, and supports more powerful data manipulation.
Example:
Diversity is a calculated selection concept that selects subjects who count as diverse using a formula created by the user. A diverse person calculated by the Diversity selection concept may be a woman, a minority ethnicity, or a person with disabilities.
Member selection concept
A member selection concept is used to uniquely identify a subject or event property that does not require any further manipulation.
Example:
Absence Paid Leave identifies the Compensation Category property on the Absence event to indicate whether an employee's absence is paid or unpaid.
Selection group
Selection groups are historical objects that were used to define a set of two or more selection concepts. These objects are either unordered or have a set order. A selection group defines related selection concepts under the same group.
Note: Selection groups are not available to create, but any existing selection groups can be analyzed in your solution and modified in a project. Because selection groups aren't available to create, you can do any of the following to achieve the functionality of a selection group:
- Create a custom dimension to assign groups based on an existing dimension. For more information, see Custom dimension.
- Create a calculated property whose formula uses if/else statements that result in numbers, such as if X, then 1, else if Y then 2, else 3, and so on. You can then create a range dimension using that calculated property where you set the display name for each range to be the "group" you want. For more information, see Calculated property and Range dimension.
Example:
- Performance Group is a selection group consisting of the selection concepts Non-Rated Performer, Low Performer, Mid Performer, and High Performer. This selection group has an order to the values.
- Generation is a selection group that defines a set of selection concepts including Traditionalists, Boomers, Gen X, Gen Y, and Gen Z.
Mapping
A mapping is a connection between columns in a source and attributes in a data load target. This allows the data load to populate values for an analytic object. Data coming from multiple sources systems may appear in different forms, requiring mapping to associate those values throughout the data.
Example:
- The Employee source contains a column called EmployeeID. A mapping connects this column to the Employee subject's Employee ID property.
- Gender may have different data values across multiple source systems, such as man and woman, 0 and 1, M and F, among others. Using Visier, a concept for Woman is created and used to define content. Data is later associated with or mapped to the Woman concept to specify that all genders mapped to it are considered women.
Data type
Data types define the structure of data records. A data type is defined in terms of one or more properties and every property has a corresponding data type. Use this object to set the different structures of your data.
Example:
The data type Currency defines a structure that consists of two characteristics: magnitude and currency code. The property Salary, which is of the data type Currency, has the value [100,000][USD].
Basic data type
The simplest data type that has a single value. Use this type for data that can only have one value.
Example:
Boolean is a basic data type. The property Top Talent, which is of the Boolean data type, can have a value of either True or False.
Leveled data type
Leveled data types give hierarchical value to basic data types. The number of levels defined by this data type help characterize the associated property.
Example:
Browser is a data type with two levels: browser and version.
Multi-value data type
Multi-value data types consist of multiple basic data types. These data types permit a one-to-many relationship, allow grouping used for data lifecycles, and are not hierarchical. This object is useful for more complex data requirements.
Example:
Assignment Allocation is a multi-value data type consisting of basic data types such as strings (Assignee, Assignment ID), numbers (Time Allocation), dates (Start Date, End Date), and booleans (Is Ended).
Dimension
A dimension organizes unique values of an attribute into a list or a hierarchical structure for use as a filter or group by in your solution. Dimensions map members or events to dimension members. Use the dimension object to classify data and differentiate one data record from another, such as the who, when, where, and what of the data.
Example:
The Location dimension is used to map an Employee subject to the dimension member corresponding to the location where the employee lives, such as Chicago.
Custom dimension
A custom dimension is built manually to act as a standard for other dimensions to map into. This type of concept references one existing dimension and creates new groups to classify the dimension members. Each of the reference dimension's members must be mapped to the groups. In this way, custom dimensions allow the user to provide more refined analysis through unique groups made up of selected dimension members.
Example:
To map employee performance levels, a custom dimension references the Performance Rating dimension. This custom dimension has the groups High Performer, Mid Performer, Low Performer, and No Performance Rating.
Leveled dimension
Leveled dimensions have a fixed number of levels on each path through the hierarchy. A leveled dimension can have as few as one level, such as a dimension like Gender, which is not hierarchical.
All data records are associated with a member on each level of the hierarchy. That is, if a record is associated with a leaf member, it is then associated with all the ancestors of that leaf member. Use a leveled dimension to organize hierarchical data with a fixed number of levels for each hierarchy branch.
Example:
In a Location hierarchy, each member has the same number of levels. The branch structure begins at the overarching region level (for example, North America, EMEA, APAC) and must have a country that splits into states, followed by cities.
Member map
Member maps unify dimension members that exist for multiple analytic objects. Member mapping allows the user to define equivalents across source system dimensions.
Example:
Multiple source systems may use different names to describe the same location, such as USA and U.S.A.
Parent-child dimension
Parent-child dimensions are hierarchical dimensions in which members of the hierarchy are directly associated with another member in the hierarchy. A member has a parent and these associations collectively define the hierarchy.
This type of dimension may create unbalanced hierarchies because each parent branch will have various numbers of children. Use a parent-child dimension to express hierarchical relationships between any members in the hierarchy.
Example:
In a Supervisory hierarchy, the top-level parent is the CEO. The CEO branches down into their direct reports. Each direct report will have their own direct reports, but the number for each will not be uniform. This creates an unbalanced hierarchy with differing numbers of branch levels and members for each section.
Range dimension
Range dimensions organize numeric values into distinct groups for better visualization and filtering. The ranges are defined by the user. Use this dimension to arrange values into defined ranges for grouping in your solution.
Example:
- To group Headcount by Budgeted Direct Compensation, a range dimension is used to group the user-defined compensation ranges to visualize the number of employees at each compensation range, such as $50,000–$75,000.
- In a Breakdown of Headcount by Organization, a filter shows the number of employees in the $100,000–$150,000 Budgeted Direct Compensation range.
Explanation
Explanations provide in-context help inside your solution. These are embedded in one or more metric explanations throughout the solution or inserted into other explanations, creating nested explanations. A significant benefit of using explanations is that content is only created once, rather than multiple times for each relevant metric explanation.
Example:
The Supplemental Pay Guidance explanation is embedded in the metrics Budgeted Total Supplemental Pay and Actual Supplemental Pay per Employee, among others. It references another explanation, Direct Compensation, and links to that explanation for further information about the topic.
Guidebook
Guidebooks contain content created to introduce users to pre-built business questions and analyses. These allow users to quickly understand and visualize their data in the context of specific business concerns. Guidebook content is fully customizable by the user in order to edit or replace content to suit their needs.
Example:
The Talent guidebook contains pre-built content to introduce users to talent topics such as compensation, retention, and engagement.
Topic
Topics cover a specific area of a given solution. They consist of pre-built analyses that answer business questions around the topic. You can set the analysis context for a topic that will apply to all of its analyses, such as time period and filters.
Example:
Retention is a topic within the Talent guidebook. This topic contains pre-built analyses focused on the exit rates of employees.
Metric
A metric is a calculation based on one or more attribute values of analytic objects. From a business perspective, a metric is a concern that is quantified as a number. Metrics are useful for creating a broad range of insights into your data through the values calculated from analytic objects.
Example:
Employee Exit Count is a metric that aggregates the number of employees who left the organization. This is a business concern that is visually quantified through the metric.
Calculation concept metric
A calculation concept metric is generated from a calculation concept. It differs from the concept itself by performing calculations on selected populations within a specific time period. While calculation concepts create hierarchical relationships between calculations in a parent-child structure, calculation concept metrics use the structure built by the concept to perform calculations on populations at selected time periods.
Example:
Actual Benefits per Employee is a calculation concept metric that calculates the compensation components provided as benefits per employee during the selected period by summing the benefits for all employees and dividing by the number of employees. The benefits are calculated through the Total Cost of Workforce calculation concept, making this a calculation concept metric.
Derived metric
A derived metric uses another metric, or several metrics, in its calculation. These are often slight variations on a base metric and are particularly useful for metrics calculating rates. Derived metrics allow you to further analyze business concerns related to your base metrics.
Example:
Manager Ratio is a derived metric that is calculated using the Manager Headcount and Headcount metrics.
Process concept metric
A process concept metric is generated from a process concept. It differs from the concept itself by performing calculations on selected populations within a specific time period. While process concepts define the stages that a subject goes through for a particular process, process concept metrics use the defined stages to perform calculations on populations at selected time periods.
Example:
Success Rate (Normal Process) is a process concept metric that calculates the number of applicants that ended the period in the Hired Yet to Start stage. The population is calculated through the Normal Process process concept, making this a process concept metric.
Module
Modules define what content is visible and available pertaining to specific solutions. Content is allocated to one or more modules and surfaces when a user has access to those modules.
Example:
The Talent module has allocated content via tags, analyses, explanations, metrics, concepts, dimensions, subjects, events, overlays, and predictions relating to employee retention and development.
Prediction
A prediction is a forecast of future events with advanced machine learning models. These prediction models aid in workforce analysis and planning. There are three available predictions: Risk of Exit, Propensity for Job Transition, and Propensity for Promotion. All three predictive models look at data from a training set that pulls from historical values over a minimum interval, such as 24 months, to make predictions about the next year.
Example:
The Risk of Exit model predicts the employees that are most likely to resign. With these predicted likelihoods and your knowledge of your organization, you can take action as needed.
Tag
Tags are categories that group content in your solution. Any object with a particular tag is listed under that tag throughout the solution. Use tags to identify objects and content that are related.
Example:
The Compensation tag is used for the Pay Change Events metric, the Total Cost of Workforce concept, the Compensation Type dimension, and the Compensation Payout event. This tag therefore groups these objects together as relating to compensation. The Compensation tag itself is allocated to the Talent module, meaning it exists within the Talent solution.
What-if model
A what-if model is a relationship of metrics defined to derive a future projection. Future projections are calculated from a series of inputs that are historical trends recomputed for future time periods based on the default criteria. These models consist of several assumption metrics and a projection metric. The assumption metrics are variables that Visier experts have determined impact the projection metric. The projection metric is the result of the changes in your assumptions.
Example:
The Women Ratio model calculates what the Employee Ratio for Women will be at future dates if user-defined changes occur. If the Employee Ratio for Women has a historical value of 10%, the user can expect it to remain at 10% in future periods. However, a user is able to change the value to another value such as 15% to see how that would impact their Projected Employee Ratio for Women for future periods.