Entity Relationship Diagram
View the subjects and events in your analytic model and their relationships.
Who can use this feature?
Users with the following:
- Profile capabilities: Model (Read, Simple)
Not sure if you have this feature or capability? Reach out to your administrator.
Overview
An entity relationship diagram (ERD) is a visual representation of the connections between entities. The analytic model ERD visualizes all subjects and events in your model and shows the relationships between these analytic objects. Use the ERD to facilitate model design and investigate your model's current structure.
The entity relationship diagram updates in real-time to reflect the current state of your analytic model, including changes made within a project and analytic objects unique to your tenant.
You can access the entity relationship diagram within a project.
- In a project, on the navigation bar, click Model > Analytic Objects.
- In the Analytic Objects room, click Diagram.
Explore the diagram
The following screenshot shows the Analytic Objects room with Diagram view selected.

Diagram visual structure
In the diagram, you can view an analytic object's details and its relationships to other analytic objects.
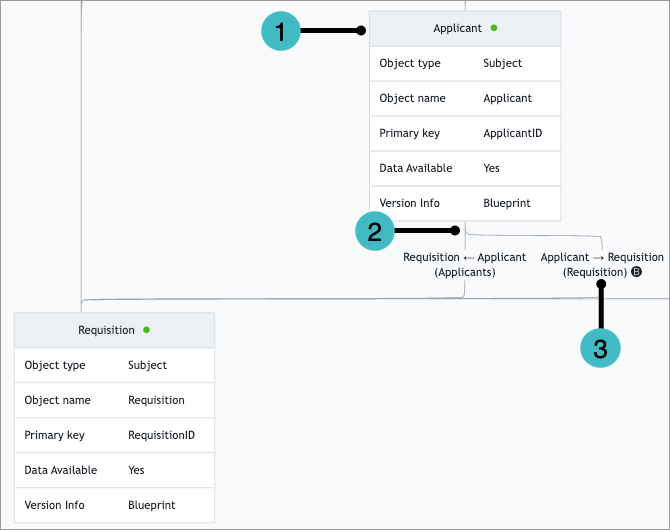
- Analytic object: An analytic object in your analytic model. The ERD includes the analytic object's display name, object type, object name, primary key, data available status, and version information.
- Relationship line: A line connecting analytic objects that reference each other.
- Relationship line label: Information about the relationship between the connected analytic objects. The label includes:
- The display names of the connected analytic objects.
- An arrow that indicates a forward reference (arrow pointing right) or reverse reference (arrow pointing left).
- The letter B to identify binding references. For more information about binding references, see Binding and non-binding references.
Diagram actions
In the diagram, you can perform the following actions:
Search and focus
- Search for specific analytic objects and filter the search results list by subjects or events.
- Zoom to an analytic object by clicking the Center on button
 in the search results list.
 - Focus on a specific object by clicking the analytic object's name in the search results list. When focused, the diagram only shows the selected analytic object and its connected objects.
Select a module
- Select the module from which to show analytic objects.
Filter
- Filter by object type, reference type, data availability, relationship status, and version information. By default, the diagram is filtered by the reference types Forward and Event-subject association.
View and export
- Change the view (zoom in/out, reset to default, full screen).
- Click and drag to navigate within the diagram.
- Export the diagram in PNG or SVG format. For more information, see Export as an image.
Export as an image
You can export the ERD in PNG or SVG format. The diagram exports with your applied focus, module selection, and filters.
- In a project, on the navigation bar, click Model > Analytic Objects.
- In the Analytic Objects room, click Diagram.
- Optional: Apply a focus, module, and filters to the diagram.
- Click Export.
- Select PNG or SVG.
- Type a file name. The default file name is
Analytic_Objects_yyyy-MM-dd_HH_mm_ss. - Select a background color.
- Select or clear Metadata. If selected, the exported image includes the date, time, project name, and the focus, modules, and filters if applied.
- Click Export.
Result: The image downloads to your device.
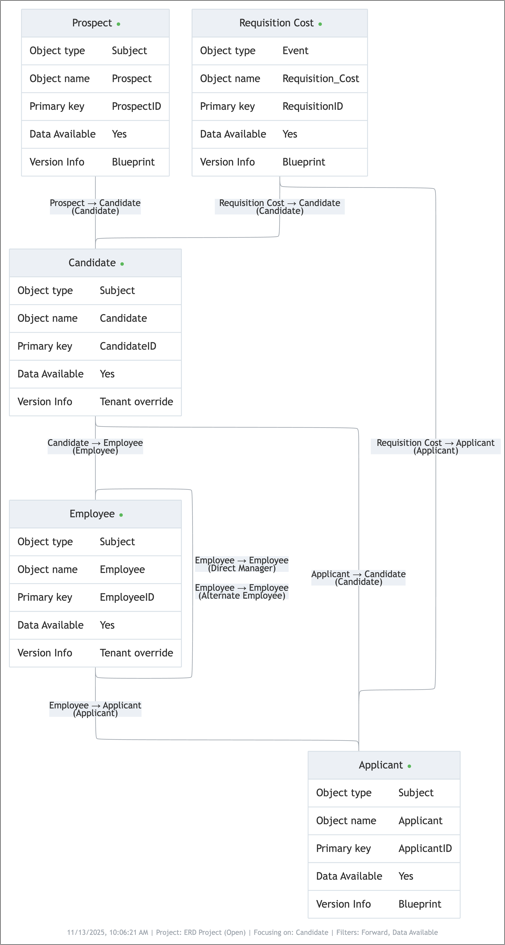
The following is an example of an exported PNG diagram with metadata, focused on the Candidate subject and filtered to only show forward references and analytic objects that have data.