
Time in Metrics
Understand how Visier handles time to calculate business data.
Overview
To analyze your data effectively, it's important to know when the data is true. Using time as a filter to view your data, you can answer questions about how your organization and employees have changed over time. This article describes how Visier interprets time in your data to make time available in analyses and visualizations, including past time, future time, validity time, and time handling in metric calculations.
In visualizations, time includes or excludes data records based on when the data was true. Time can be a:
- Visualization filter. Valid records are included based on the selected time and metric time handling.
- Chart axis. Metric values are plotted against time. Valid records are grouped based on the metric time handling in the correct time position on the chart time axis.
End users select the time period and time granularity to view data. The following screenshots show the Time picker, where users select the period and granularity, and a Trend Breakdown, where time is the horizontal axis.
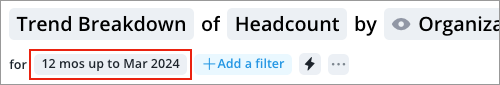
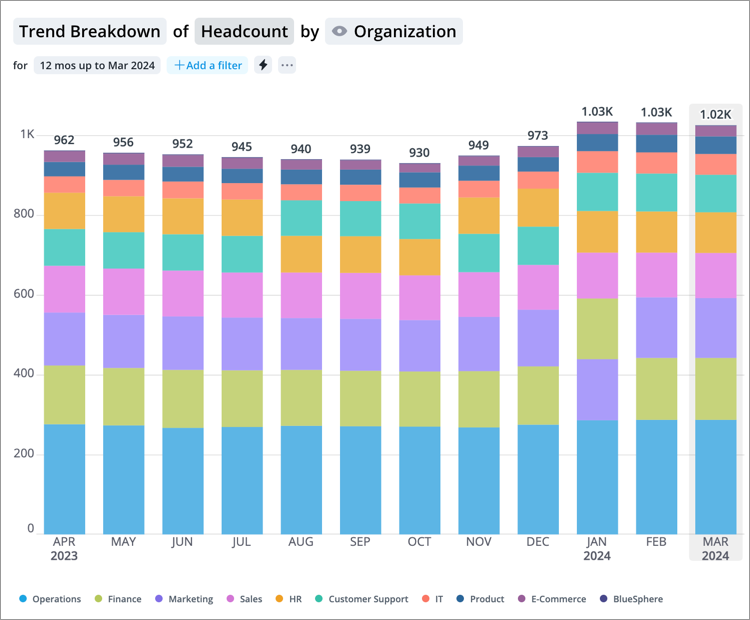
For more information about how users select time to analyze, see Change the Time Context.
Determining available time
Your users can select the time periods and granularity they want to analyze, but how does the platform determine what time periods and granularity are available to select? The data you provide to Visier determines available time. Your data file provides validity dates for each subject member and their attributes. For example, when providing employee data, each employee has a start date that represents the time that the employee is valid from. For more information about available time for end users, see How the Available Time Selection is Determined.
Analysis time vs. system time
All data files sent to Visier have time associated with the file:
- Event date or record period date: The date that a record is valid. This contributes to the available time that users can select in analyses and visualizations. For more information, see Event date or record period date?
- Upload time: The time that the file was uploaded to Visier. The platform uses upload time in override behavior to replace older data that may be corrected or updated in the latest file. Upload time is not available as an analysis time; that is, you can't ask Visier "Using data uploaded on March 31, what was the employee count for January?" Analysis time always uses the published data version, however, administrators can look back at old data versions using Data Version Snapshots.
Validity time
Time is always present in analytics. It's necessary to account for how objects and their properties change over time and the instant in time where an event happens to a subject.
Analytic objects have properties that record their validity time:
- Subject members exist over an interval defined by two dates. Attributes that change over time create multiple validity intervals for different states of the same subject instance. For example, an employee's Job Name is valid from September to December. After a promotion in January, the Job Name changes. The new Job Name has its own validity period starting from January.
- Events happen at a specific instant. Unlike subjects, events don't have duration—they mark a point in time. For example, a Hire Event on June 10.
- Overlay values' validity time is defined by either an interval (subject-like overlays) or a period (event-like overlays). To set an overlay as interval or period, see Time model.
- Interval overlays: Values are valid over an explicit date range defined by validity start and validity end dates. For example, a planned headcount of 50 valid from January 1 to June 30.
- Period overlays: Values represent aggregates for a time period defined by an effective date and the overlay's granularity setting. For example, a monthly revenue overlay with an effective date of January 2024 represents January 1 to 31. The same date a yearly granularity represents all of 2024.
Time granularity
The dates in your data files have granularity that determines the time options users can select, such as days, months, or years.
Time granularity is the level of detail of the data. The frequency of timestamps in your data determines the time granularity. If you record multiple timestamps per day, the time granularity is millisecond. If you record one timestamp per month, the time granularity is month.
Time granularity impacts the time context options when viewing subjects and events in the Explore room and analyses. You can select a time context equal to or larger than the object's defined time granularity. If the granularity for Employee is month, you can select months, quarters, and years in employee analyses, but not weeks or days, which are smaller than month.
For more information, see Time granularity.
Past time
If your organization sends full historical data to Visier, your users can select dates in the past as far back as your data extends. If your organization only keeps the latest data in Visier, your users can select dates as of the latest data load.
Additionally, an administrator can set the data start date for your Visier data, such as to start from a specific date like January 2023 or to start from a rolling date like 4 years before the latest date in your most recent data upload. For more information, see Tenant Settings.
Your users can use Visier to answer questions about past time, such as:
- How many employees were active at the end of March 2023?
- What is the history of the job title for a particular employee?
Future time
To plan for your organization's future, you can look into dates that extend past your loaded data. For example, your data might include expected start dates for incoming employees or you might calculate the retirement date for an employee based on their age. Because these events are in the future, they don't exist in your data as events. Instead, you can include them in metric formulas as calculations or properties.
Your users can use Visier to answer questions about future time, such as:
- Which teams have incoming employees whose start date is in January 2026?
- Who will reach retirement age in the next 6 months?
When planning financial forecasts in Visier, you might project future metric values based on historical data and plan values. Though these values are projections, they provide a holistic view of your workforce that allows you to plan for the future. Similarly, Visier's What-if models explore different scenarios and compare their likely outcomes for future time periods. For more information, see What-if Models.
To select dates in the future, there are two factors:
- Data records with a future date. Your data might include events due to occur later, such as an expected start date.
- Tenant end date config type. In a project, an administrator can set how the platform sets the upper limit of selectable time periods. For more information, see Tenant Settings.
Setting time handling in a metric formula
A metric formula defines how a metric value is calculated. Formulas are written in Visier Formula Language (VFL). A key part of any metric formula is its time handling—the method that determines which records to include in the calculation based on their time attributes. Every metric formula has exactly one filter for time handling.
The standard formula syntax is: on <subject//event> <time handling> filterBy(<filter condition>) aggregate <function>(<aggregation property>)
There are two factors that determine the time handling function to use in a metric:
- Analytic object of the metric (subject or event): Subjects have validity periods while events occur at a specific instant, so they work with different time filters. The analytic object of the metric determines the time filters that are available for that metric.
- Desired calculation: Multiple time handling options are available for each type of analytic object. You can choose the appropriate time handling based on what you want to measure. For example, if you want to calculate subjects valid at the end of the selected period or subjects valid at any point during the selected period.
For a list of all the time handling functions, see "Time handling" in Visier Formula Language (VFL).
Subjects and events have the following default time handling:
- Subjects: Default behavior is
validUntil instant, which queries the state at the selected time. - Events: Default behavior is
occurredIn interval, which queries over the entire selected interval.
Tip: When using the default behavior, we recommend that you omit time handling expressions in metric formulas. If omitted, the metric uses the default time handling option. For example, instead of on Employee_Exits occurredIn interval aggregate count (EmployeeID), you can simply write on Employee_Exits aggregate count (EmployeeID) to count exits.
Time handling in subject-based metrics
Each subject record has a validity period. In a metric that queries a subject, such as Employee, the formula can specify the following time handling options.
validUntil
Aggregates data at one specific instant. For example, Headcount reports the total number of employees at a single instant. If a user views Headcount and sets the time context to January 2019, Visier provides the metric value on the last instant in the period (that is, January 31, 2019 at 23:59:59.999).
The validUntil instant time handling function selects subject members whose validity period contains the specified instant.
on Employee validUntil instant filterBy(isActiveEmployee) aggregate count(EmployeeID)You can analyze point-in-time metrics over time to get a trend. Visier computes the metric values independently at each instant on the time axis.
validUntil works with any instant, including a shifted instant. Time functions can shift the instant backward or forward. For more information, see "Time" in Visier Formula Language (VFL).
on Employee validUntil shift(instant, back(period)) filterBy isActiveEmployee aggregate count(EmployeeID)forInstantsInInterval
Summarizes or aggregates subjects across an interval rather than at a single point in time by sampling the data at specific points in the interval and sum or average those points using trapezoidal integration by choosing weights for each sample to better calculate the change over time. A metric like Average Headcount can help you understand broader trends with a more dynamic view of your workforce across time, as opposed to a static count for a particular instant like Headcount.
on Employee forInstantsInInterval(interval, month) filterBy(isActiveEmployee) aggregate averageOverTime(count(EmployeeID))forInstantsInInterval(interval, month)samples the data across the specified interval at the specified granularity (month), similar to taking snapshots at regular intervals to see how many employees were active at each point and then averaging them.averageOverTimenumerically integrates the samples using the trapezoid rule to approximate the area under the curve by averaging each selected data point.Warning: The
forInstantsInIntervaltime handling filter is only valid withaverageOverTimeorsumOverTimeaggregation functions. Ending the formula withcount(EmployeeID)would lead to an incorrect result, and omittingforInstantsInIntervalcreates an invalid query that will not run.
lastKnownStateIn and lastKnownStateByFilterIn
Selects subject members that were valid at any point during a time interval—not just at the interval's end. This is useful to capture all members that were present during a period, even if a member exited before the period ended.
There are two last known state variations: lastKnownStateIn and lastKnownStateByFilterIn, as described next.
lastKnownStateIn returns the last valid state for each member within the interval. This is used for subjects whose records terminate, like Employee. The effective date of last known state records are:
- If a member is still valid at the interval end, the effective date is the interval end.
- If a member's validity ended during the interval, the effective date is the date their validity ended.
on Employee lastKnownStateIn(interval) aggregate count(EmployeeID)lastKnownStateByFilterIn adds an inactive filter condition, selecting the last known state of members based on that condition. To include the member, the member must either still be active (does not pass the inactive condition) or have transitioned to the inactive state during the interval. This is used for subjects whose records do not terminate, like Applicant, and are instead deemed inactive based on other criteria, such as an Is Closed concept. The effective date of last known state records are:
- If a member has not transitioned to the inactive state at the interval end, the effective date is the interval end.
- If a member transitioned to the inactive state during the interval, the effective date is the date that the transition happened.
on Applicant lastKnownStateByFilterIn(interval, isClosedApplicant) aggregate count(ApplicantID)Time handling in event-based metrics
Events represent moments in time when an event happens to a subject—such as a hire, a promotion, or an exit. Events occur at a specific instant. In a metric that queries an event, such as Employee Start, the formula can specify the following time handling options.
occurredIn
Selects occurrences of an event that happened within an interval. If an interval is omitted, Visier defaults to the interval provided by the current time axis position. This is the default and most common time handling for events.
on Compensation occurredIn(interval) aggregate(sum(Compensation.Amount))occurredIn works with any interval, including a shifted interval. Time functions can shift the interval backward or forward. For more information, see "Time" in Visier Formula Language (VFL).
on Compensation occurredIn((shift(interval, back(months(12)))) aggregate(sum(Compensation.Amount))forIntervalsInInterval
Creates a time filter where the specified period is divided into multiple intervals based on the specified granularity, then aggregates events that occurred within each smaller interval, and then aggregates across all intervals based on the provided aggregation.
on Attendance forIntervalsInInterval(interval, day) filterBy (Attendance.isPhysical) aggregate countOverIntervalsGT(Attendance.EmployeeID, 1)forIntervalsInInterval(interval, day)divides the period at the specified granularity (day) to see how many employees had attendance during each day during the period.countOverIntervalsGTonly counts the attendance events during a day if more than one employee had attendance.Note: The
forIntervalsInIntervaltime handling function is only valid with thecountOverIntervalsGTaggregation function. Ending the formula withcount(AttendanceID)would lead to an incorrect result and omittingforIntervalsInIntervalcreates an invalid query that won't run.
Time handling and analytic object transformations
Transformations create alternative views of an analytic object, allowing you to derive insights that the base object doesn't directly provide. For example, you can turn subject state changes into events, measure transitions between subject states, or examine the context before an event occurred.
changes (subject to event)
Captures any state changes that occurred to a subject at the exact moment the change happened, effectively creating an event analytic object for the subject. After applying this transformation to a subject, the event time handling option occurredIn(interval) is available to use.
on changes(Employee) occurredIn(interval) filterBy hasChanged(Location) aggregate(count(EmployeeID))The changes function generates two events for each subject state change. One event captures the previous value to the next value and the second event captures the next value to the previous value. The changes function also generates a conception event (when a subject's validity starts) and a termination event (when a subject's validity ends). To focus on previous or next changes, not both, use previousChanges or nextChanges.
- previousChanges: Captures conception events and events related to previous state changes.CopyFormula example: Requisitions with status changes in period
on previousChanges(Requisition) aggregate count(RequisitionID) - nextChanges: Captures termination events and events related to next state changes.CopyFormula example: Skills lost due to exited employees in period
on nextChanges(Skills) occurredIn interval filterBy (isEmployeeAcquiredSkills && next(isEmployeeAcquiredSkills)) && Skills.EmployeeReference.isActiveEmployee && next(not Skills.EmployeeReference.isActiveEmployee) aggregate count(Skills.SkillsID)
traversals (subject to event)
Creates an event view to analyze successful transitions across states. In a metric formula, a traversal uses a from and to condition to represent the state transition. Traversals are useful to analyzes flows, such as applicants progressing through the recruitment pipeline or employees transitioning between departments. Optionally, use excluding(<condition>) to exclude particular time periods from the traversal.
on traversals(Applicant) from(Interviewing) to(Hired) occurredIn(interval) aggregate(count(ApplicantID))priorState (event to subject)
Transforms an event table into another event table where each event is associated with the previous state of the subject before the event happens. This is useful when understanding the lead up to an event is critical, such as an employee's state prior to a promotion.
on priorState(Promotion) occurredIn(interval) aggregate(median(Promotion.Employee.PayLevel))Time handling in nested queries
A nested query defines a property whose values come from aggregating other records in a different table by going through the reference between the two tables. A nested query can be assigned to a local variable using the := function within a formula. Variables only exist in the formula that they're written in; you cannot reference a nested query's variable in a different object's formula.
Every query, including nested queries, has exactly one time filter. Nested queries can only access time instants, like the EffectiveDate of the record from the outer query, and not time intervals like occuredIn(interval) or lastKnownStateIn(interval). This ensures fast execution of nested queries. If a nested query requires access to the outer query's interval, alternative solutions are available, which won't always match the original interval.
One approach is to use the periodOf(instant) function within the nested query. This function reconstructs a time period based on the outer query instant, period type, and count of the outer query. However, this has some limitations. The issue arises when the outer query's interval spans multiple underlying periods, like a multi-month query, and the query instant falls before the final period. Because the periodOf(instant) function only uses the instant and the full period length to define a new interval, it generates an interval that ends on the period containing the instant. This doesn't recreate the original, multi-period outer query interval.
If no time filter is specified in a nested query, validUntil(instant) is used in the nested query. Because instant in a nested query is inherited from the outer query, further nested queries on a nested query state record will not relate to the validity interval of that nested record, but will return results relevant to the outer query date. However, sub-nested queries are not valid for validIn queries without an explicit dateField.
Nested queries do not support the following time handling functions:
- interval
- lastKnownStateIn
- lastKnownStateByFilterIn
The following time handling functions are only valid in nested queries:
- validIn
For more information about nested queries, see Nested query formula examples.
Troubleshooting time handling
Updates to time handling behavior can affect how metrics compute differences over time, impacting any Guidebooks and analyses that use the metric.
To address unexpected results in metrics related to time handling:
- Check metric lineage: Determine which records the metric is selecting. For more information, see Validate Metric Values Using Metric Lineage.
- Verify time handling: Ensure records are selected at the correct time. For more information, see "Time handling" in Visier Formula Language (VFL).
- Adjust filters and aggregation: After confirming time handling, review filter conditions and aggregation methods. For more information, see "Aggregation" and "filterBy" in Visier Formula Language (VFL).