Pass Filters with Embedded Visier Visualizations
Filter passing allows a web application or web portal to pass visualization filters implicitly into an embedded Visier visualization.
Overview
With filter passing, you can configure a default filter or dynamic filters to apply to embedded Visier visualizations in your web portal or application. To learn how to embed a visualization in your web application or web portal, see Embed a Visualization.
You may want to configure filter passing to provide a default filter in embedded visualizations for your users, or to provide your users with different filtering options to which the hosting application or portal passes into the embedded visualizations. This is useful when you want to create a base visualization that will be used in multiple pages of your web application or portal and ensures users will see relevant data. This means you don't have to create unique visuals in Visier each time.
You can configure the filters to apply to an embedded visualization if you are an IT administrator or development team member with access to Studio.
If a visualization is embedded in a web application or portal without filter passing, the visual is displayed exactly as it appeared in Visier. With filter passing, you can configure a default filter or dynamic filters to apply in the web portal or application.
- Default filter: Set the initial filter to apply to an embedded visualization. You may use one or more filters in the default, such as Age and Job Name. The default filter is configured by adding an additional attribute to the code snippet that is provided from the analysis as part of the embedding workflow.
- Dynamic filters: Define a set of filters to pass in an embedded visualization. You can configure your web application or portal to programmatically control the filters of an embedded visualization. Dynamic filters are configured by adding specific JavaScript to the embedding page.
Note: If the user clicks on a visual in your web application or portal that has default or dynamic filters configured, the user is redirected to Visier and the configured filters are applied to the visual in the full Visier solution, such as in a guidebook or analysis.
The following list describes the order in which to complete the steps to set up filter passing.
- Retrieve the unique ID for the filters you want to use. See Step One: Find the filter's unique ID.
- Determine the syntax for your filter. See Step Two: Construct the filter syntax.
- Edit the visual in Visier. See Step Three: Prepare the visual for filtering.
- Put it all together. See Step Four: Pass filters to an embedded visual.
- Optional: If you run into an issue, try some troubleshooting methods. See Troubleshoot common errors.
The following sections guide the IT administrator and/or development team through setting up an embedded visual to pass a filter.
Step One: Find the filter's unique ID
You can use dimension members to filter an embedded visualization. This can be achieved by constructing a filter where the correct syntax consists of a combination of unique IDs from analytic objects, dimensions, and dimension members. To properly construct the filter syntax, you must first obtain these unique IDs. Record the object's ID for use in Step Two: Construct the filter syntax.
Analytic objects or dimensions
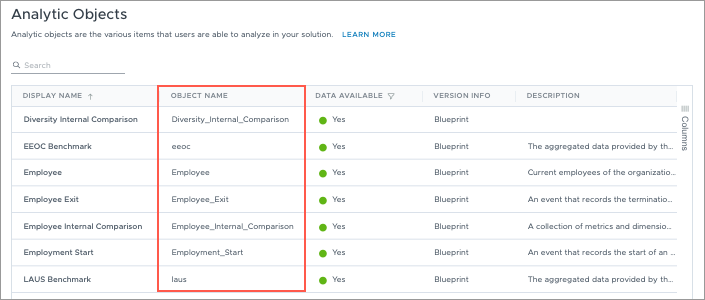
The ID for an analytic object or dimension is its unique object name. Follow the procedure below to retrieve the ID for an analytic object or dimension.
- Open a project.
- Navigate to Model > Analytic Objects or Dimensions.
- In the Search bar, type the display name of the object. For example, Employee Exit.
- In the Object Name column, find the unique object name. For example, Employee_Exit.

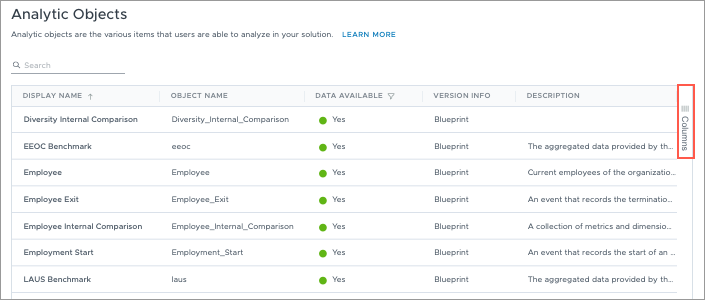
Tip: If you cannot find the Object Name column, click Columns on the right side of the table, as shown below. In the list of column options, select Object name.

Dimension members
The ID for a dimension member comes from your data. You can find the unique ID in your source data or in Visier. After you retrieve the unique ID, the member ID is used in the following syntax structure: [Hierarchy].[MemberId]. For example, if the unique ID for the dimension member "Engineer" is DEV01, the syntax would read as follows: "[Hierarchy].[DEV01]".
To find the unique ID in Visier:
- Open a project.
- Navigate to Model > Dimensions.
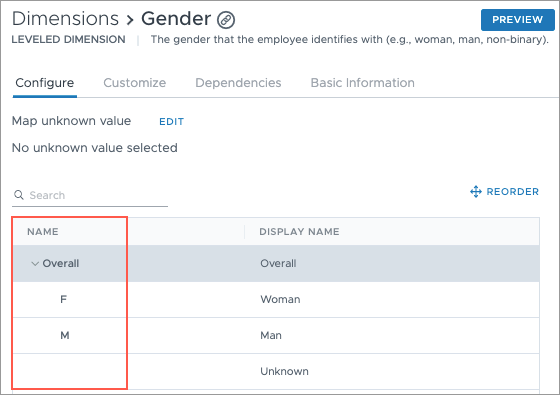
- Find and select the dimension that the dimension member belongs to. For example, find and select the "Gender" dimension to find its dimension member "Woman".
- In the dimension, navigate to Configure.
- In the Name column, find the name of the dimension member that you want to use in your filter, as shown next. The name is the dimension member's unique ID.

Tip: Dimension members belong to a dimension which is associated with an analytic object. If filtering by a dimension member, you must know the unique IDs of the dimension, analytic object, and the dimension member. For example, you may want to filter your visualization by woman. "Woman" is a dimension member of the "Gender" dimension, which is part of the "Employee" analytic object. To filter by "Woman", you need the unique IDs for Employee, Gender, and Woman. To find the unique IDs for the analytic object and dimension, see Analytic objects or dimensions.
Step Two: Construct the filter syntax
To filter a visualization, Visier uses data from the analytic objects and dimensions in your solution. To pass a filter in an embedded visual, you must assemble a statement using the filter IDs that you retrieved in Step One above.
The supported filter types are:
- Include/exclude filter: A method to filter the visualization by specific included or excluded objects. For example, you can include the "Gender" dimension member "Woman" and exclude the "Job Name" dimension member "Engineer". This filters the visualization to include data about women in the organization and exclude those women who are engineers.
- Numeric range filter: A method to filter the visualization by a range of numbers. For example, you can filter the dimension "Age Range" by a numeric range of 25 to 30. This filters the visualization to only include data about individuals aged 25 to 30 years old.
The following sections describe the syntax associated with supported filter types.
Include/exclude filter
An include/exclude filter allows you to choose specific objects to include or exclude in your visualization filter.
Parameters
| Parameter | Description | Type | Required | Notes | ||
|---|---|---|---|---|---|---|
| filters | An array that represents the filters to apply to the visualization. | array | Required | |||
| includeExclude | An object representing the dimension members to include or exclude in a visualization. | object | Required | |||
| hierarchyId | The object name of the dimension to filter. | string | Required | |||
| subjectReferences | A list of strings representing the path from the analytic object to the dimension. | array | Required | |||
| includedMembers | A list of strings representing the dimension members to include in the visualization.
Syntax structure: "[Hierarchy].[{Path to Member}]" where {Path to Member} is the dimension member's unique ID. If the dimension has multiple levels, this includes multiple member IDs to represent the path to the member you're filtering by. |
array | Required | This array may be blank. | ||
| excludedMembers | A list of strings representing the dimension members to exclude from the visualization. Syntax structure: "[Hierarchy].[{Path to Member}]" where {Path to Member} is the dimension member's unique ID. If the dimension has multiple levels, this includes multiple member IDs to represent the path to the member you're filtering by. |
array | Required | This array may be blank. | ||
Examples
The following examples show different ways to use the include/exclude filter.
Example: An include/exclude filter on the "Employee" subject that includes the "Chief Executive Officer" and "Chief Financial Officer" dimension members.
filters: [
    {
        includeExclude: {
            hierarchyId: "Job_Name",
            subjectReferences: ["Employee"],
            includedMembers: ["[Hierarchy].[Chief Executive Officer]", "[Hierarchy].[Chief Financial Officer]"],
            excludedMembers: []
        }
    }
]
Example: An include/exclude filter on the "Employee" subject that filters multiple dimensions and dimension members. It includes "Woman" and "British Columbia". Because "Location" is a leveled dimension, you must list the entire path to the excluded dimension. In this example, the filter path is North America > Canada > British Columbia.
filters: [
    {
        includeExclude: {
            hierarchyId: "Gender",
            subjectReferences: ["Employee"],
            includedMembers: ["[Hierarchy].[Woman]"],
            excludedMembers: []
        },{
            hierarchyId: "Location",
            subjectReferences: ["Employee"],
            includedMembers: ["[Hierarchy].[North America].[Canada].[British Columbia]"],
            excludedMembers: []
        }
    }
]
Numeric range filter
A numeric range filter allows you to specify a specific range of numbers to filter a dimension by.
Parameters
| Parameter | Description | Type | Required | Notes | |||
|---|---|---|---|---|---|---|---|
| filters | An array that represents the filters to apply to the visualization. | array | Required | ||||
| numericRangeFilter | An object representing a range of numbers to filter by in a visualization. | object | Required | ||||
| hierarchyId | The object name of the dimension to filter. | string | Required | ||||
| subjectReferences | A list of strings representing the path from the analytic object to the dimension. | array | Required | ||||
| isIncluded | If "true", the specified range is excluded. | Boolean | Optional | Default is false. | |||
| numericRange | An object that specifies the values for the range. | object | Required | ||||
| rangeStart | The starting value for the range. | string | Required | ||||
| rangeEnd | The ending value for the range. | string | Required | ||||
| rangeType | The type of range to use in the visualization. This specifies whether the start and end values in the range are included or excluded.
Valid values:
|
string | Required | ||||
Examples
filters: [
    {
        numericRangeFilter: {
            hierarchyId: "Age_Range",
            subjectReferences: ["Employee"],
            isExcluded: false,
            numericRange: {
                rangeStart: "25",
                rangeEnd: "28",
                rangeType: "InclusiveExclusive"
            }
        }
    }
]
Multiple filters
If you want to include multiple filter types in your embedded visualization, each filter must be an element in the filters array.
Parameters
| Parameter | Description | Type | Required | Notes | |
|---|---|---|---|---|---|
| filters | An array that represents the filters to apply to the visualization. | array | Required | ||
| includeExclude | An object representing the dimension members to include or exclude in a visualization. | object | Optional | See Include/exclude filter. | |
| numericRangeFilter | An object representing a range of numbers to filter by in a visualization. | object | Optional | See Numeric range filter. | |
Examples
Example: An include/exclude filter on the "Employee" subject that includes "Plant Supervisor" and "Plant Operator", and a numeric range filter for the ages 25-30.
filters: [
    {
        includeExclude: {
            hierarchyId: "Job_Name",
            subjectReferences: ["Employee"],
            includedMembers: ["[Hierarchy].[Plant Operator]","[Hierarchy].[Plant Supervisor]"],
            excludedMembers: []
        }
    },{
        numericRangeFilter: {
            hierarchyId: "Age_Range",
            subjectReferences: ["Employee"],
            isExcluded: false,
            numericRange: {
                rangeStart: "25",
                rangeEnd: "30",
                rangeType: "InclusiveExclusive"
            }
        }
    }
]
Step Three: Prepare the visual for filtering
To pass filters into an embedded visualization, you must configure the embedding analysis to accept filters.
- Navigate to the analysis that contains the embedding visual that will support filters. There are two ways to navigate to an analysis:
- If you created the analysis and have the Embed Analytic Content capability:
- Open the solution experience and, on the navigation bar, click Analyses.
- Select the analysis you created that contains the visualization you want to embed in your application or web portal. The first visualization displayed in the analysis will be embedded in your target environment.
- In the upper-right corner, click the Edit button
 .
.
- If you are embedding a visualization from a Visier-created analysis and have an administrator capability:
- Open a project and navigate to Model > Analyses.
- Select an analysis from the list that contains the visualization you want to embed in your application or web portal. The first visualization displayed in the analysis will be embedded in your target environment.
- In the upper-right corner, click Edit Analysis.
Caution: If you edit a Visier-created analysis, you will not receive future updates to that analysis from Visier experts. For more information, see Edit Visier Content.
- If you created the analysis and have the Embed Analytic Content capability:
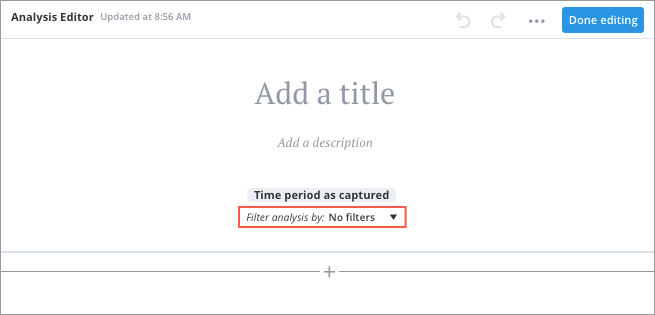
- If the Driving Subject is not already set for the analysis, set the Driving Subject filter. In the Analysis Editor, under the analysis title, expand Filter analysis by, as shown next. The Driving Subject is the object associated with the filters you want to add, such as Employee. This configures the subject on which filters can be applied for the whole analysis. For more information, see The driving subject.

- Click Done editing.
Result: Your embedded visualization is ready to accept filters.
Step Four: Pass filters to an embedded visual
Now that you retrieved the unique filter IDs (Step One), constructed the filter syntax (Step Two), and configured the analysis to accept filters (Step Three), you can add filters to the embedded visualization.
As described previously, there are two ways to pass a filter:
- Default filter: Set the initial filter to apply to an embedded visualization. You may use one or more filters in the default, such as Age and Job Name. The default filter is configured by adding an additional attribute to the code snippet that is provided from the analysis as part of the embedding workflow.
- Dynamic filters: Define a set of filters to pass in an embedded visualization. You can configure your web application or portal to programmatically control the filters of an embedded visualization. Dynamic filters are configured by adding specific JavaScript to the embedding page.
Option One: Pass a default filter
To define a default filter in an embedded visual to apply when the visual first loads in your web application or web portal, a filters attribute must be added to the chart config passed into embedCharts.
Follow the below steps to successfully pass a default filter.
- Retrieve a code snippet from the Visier analysis by following the instructions in Embed a Visualization.
- In the code snippet, find the embedCharts method call and the chart config passed as a parameter.
- In the corresponding chart config, add an attribute called filters. This attribute includes your filters to pass into the embedded visualization. The following example shows the correct format to use.
Example: Add the filters attribute to the chart config. It includes two filter types. The include/exclude filter includes the dimension members Plant Operator and Plant Supervisor. The numeric range filter filters by the ages 25 to 30.
app.embedCharts([
    {
        contentId: "bbfdf21b-1f37-4504-8397-ac97043555f1",
        containerId: "chart-container",
        filters: [
            {
                includeExclude: {
                    hierarchyId: "Job_Name",
                    subjectReferences: ["Employee"],
                    includedMembers: ["[Hierarchy].[Plant Operator]", "[Hierarchy].[Plant Supervisor]"],
                    excludedMembers: []
                }
            }, {
                numericRangeFilter: {
                    hierarchyId: "Age_Range",
                    subjectReferences: ["Employee"],
                    isExcluded: false,
                    numericRange: {
                        rangeStart: "25",
                        rangeEnd: "30",
                        rangeType: "InclusiveExclusive"
                    }
                }
            }
        ]
    }
]);Result: When the embedded visualization is rendered, the filters are passed in the visualization.
Option Two: Pass dynamic filters
To pass filters dynamically, the hosting web application or web portal executes a JavaScript. Use the following JavaScript code snippet to pass dynamic filters.
var your_JSON = {messageType: "set_filters", filters: [
    {supported_filter}, ...
    ]};
document.getElementById("visier-embedded-app-frame-containerId").contentWindow.postMessage(your_JSON, "*");
You must change some of the attributes in the above JavaScript to be unique to your web application or web portal, as described next.
- your_JSON: Identifies the data you want to pass to the iframe. This can be any string of your preference; it does not have to read "your_JSON".
- supported_filter: An array of supported filters to pass into the embedded visual. See Step Two: Construct the filter syntax.
- containerID: The container ID as defined in your chart config code snippet. In the below example, the containerID is "chart-container".
Example: A dynamic filter using JavaScript. It includes two filters. The include/exclude filter includes the dimension members Plant Operator and Plant Supervisor. The numeric range filter filters by the ages 25 to 30.
var your_JSON = {messageType: "set_filters", filters: [
    {
        includeExclude: {
            hierarchyId: "Job_Name",
            subjectReferences: ["Employee"],
            includedMembers: ["[Hierarchy].[Plant Operator]","[Hierarchy].[Plant Supervisor]"],
            excludedMembers: []
        }
    },{
        numericRangeFilter: {
            hierarchyId: "Age_Range",
            subjectReferences: ["Employee"],
            isExcluded: false,
            numericRange: {
                rangeStart: "25"
                rangeEnd: "30"
                rangeType: "InclusiveExclusive"
            }
        }
    }
]}; document.getElementById("visier-embedded-app-frame-chart-container").contentWindow.postMessage(your_JSON, "*");
Troubleshoot common errors
The following scenarios provide guidance for common errors that may occur while setting up filters for embedded visualizations.
| Error | Description | How to troubleshoot |
|---|---|---|
| The embedded visual renders but the filter isn't passed. | The content may be incorrect. For example, if you type Job Name's unique ID as "Job-Name-Wrong" instead of "Job_Name". | Review and correct your filter IDs. See Step One: Find the filter's unique ID. |
| Error message: Chart data was not present or incorrect type was found. | The filter syntax may be incorrect. For example, if you type the include/exclude filter as "include-Exclude-Wrong" instead of "includeExclude". | Review and correct your filter syntax. See Step Two: Construct the filter syntax. |
| Error message: Chart data was not present or incorrect type was found. | The analysis may not be enabled to accept filters. | Edit the analysis to enable filtering. See Step Three: Prepare the visual for filtering. |
