Get Started with Visier Embedded Analytics
Learn how to get access to a tenant, load sample data, and configure the analytic model to get people insights.
Introduction
Experience first-hand how Visier lets you build, extend, and scale people analytics with unparalleled flexibility.
In this tutorial, you will learn how to onboard data into Visier, set up the analytic model, and explore the pre-built questions and answers to get people insights.
Objectives
After you get access to a tenant, you can onboard your data into Visier. To make things easy for this tutorial, we will provide you with sample data. Once we have loaded data into Visier, we will show you how to run a job to generate a data version. After successfully loading data in Visier and generating a data version, the next step involves configuring concepts to give meaning to your data. After we configure the concepts, we can start using the analytic capabilities of the platform and explore our data.
You will learn how to:
- Upload data files
- Run a job to generate a data version
- Configure concepts
- Preview and validate your data
- Use the analytic capabilities of the platform and explore pre-built content
Decide how you want to load your data
There are different ways you can load your data into Visier including data connectors, APIs, and flat file uploads. For more information, see Data In.
To keep things simple, we have sample data that you can load to test out Visier.
You have the option of loading this sample data into your tenant by uploading the sample data files in the Visier solution. For instructions, see Upload data files in the Visier solution.
Upload data files in the Visier solution
Now that you've chosen to upload data files in the Visier solution, we will first walk you through how to download the sample data, upload your first data files in a new Visier tenant, and then take you through how to generate sources for your data.
Prepare data files
To make it easy, we have sample data files that you can load to test out Visier.
Download the sample data files.
The compressed file includes sample data for employee, employee starts, employee exits, and organization hierarchy.
Before we upload our data into Visier, we need to make sure our data files are in the expected format, and follow the recommended file structure and naming conventions. This in an important step as it ensures our files will be successfully uploaded to the solution. To learn more about how to structure your data files, see Data File Guidelines. For the purposes of this tutorial, we can skip this step as the sample data files are in the expected format.
Upload data files in the Visier solution
After our data files have been prepared, the next step is to upload them within Studio, which serves as the administrative design space. To learn more about Studio, see Studio Navigation.
After you sign in to Visier, you are directed to the solution experience or Studio. This is dependent on capabilities, permissions, and if you've previously loaded data into Visier.
Contents of the files:
The provided files contain sample data for one administrating (admin) and two analytic tenants: Tenant1 and Tenant2. The data includes Employee, Exits, Starts, and Org Hierarchy records for the period between January 2021 to November 2021.
Necessary adjustments:
While these templates are a great starting point, you'll need to customize them to fit your application and data requirements. Here are the steps:
- Your personal stamp with admin code: Each admin has a unique identity in the form of an admin code. Adjust the TenantCode column to match your specific admin code. All instances of SamplePartner will need to be replaced with your own.
- Folder naming: Consistency is key, so remember to alter folder names to match your new admin code.
- Tenant naming: The provided templates use two generic tenant names: Tenant1 and Tenant2. If you have chosen different names for your tenants, please update these names in the files accordingly.
- Sign in to Visier.
- Do one of the following:
- If you start in the solution experience, on the navigation bar, click Studio
 to access Studio, and then click Data > Data Transfers.
- If you start in Studio, on the global navigation bar, click Data > Data Transfers.

- If you start in the solution experience, on the navigation bar, click Studio
- Compress the data files you want to upload in a ZIP file. You can also upload CSV, XLS, XLSX, and PGP-encrypted files. We can skip this step because the sample data comes as a compressed file. The ZIP file contains data files for employee, employee starts, employee exits, and organization hierarchy.
- Click Upload File and select the compressed sample data file you downloaded previously. In this tutorial we're uploading the file WFF_SamplePartner.zip.
- Click Upload.
If you upload an XLS or XLSX file containing multiple sheets, each sheet will create a unique data transfer.
Result: The data files are encrypted and uploaded to a secured file server.
Generate sources
Now that our data files have been uploaded to the solution, we need to generate sources for each file. Sources store data for your solution, for example, Employee data is stored in the Employee source. For more information, see Sources.
If it's your first time uploading this type of data, the data transfer will fail validation because there is no source connected to it. To resolve this failure, generate a source as described next. If you have previously uploaded this type of data, your data transfer automatically connects to its existing source.
Let's start by generating a source for the employee file.
To generate a source:
- In the Data Transfers tab, hover over an uploaded file.
- In the Actions column, click the Generate source button
 .
.Result: A source is created.
Repeat the above steps for the uploaded employee start, employee exit, and organization hierarchy files. In this tutorial, you will generate the following sources:
- Employee_Admin_20210101_to_20211130
- Employee_Start_Admin_20210101_to_20211130
- Employee_Exit_Admin_20210101_to_20211130
- Organization_Hierarchy_Admin_20210101
We can check our sources to verify the data was extracted correctly.
- On the global navigation bar, click Data > Sources.
- Select a source and click the Uploaded Files tab.
- Check the latest uploaded file and confirm that the number of records is correct in the Records column. There should only be one file for each source as this is the first time we have loaded this data.
The following table describes the number of records for each file.
Source | File |
|---|---|
employee_tutorial | Employee_Admin_20210101_to_20211130 |
employment_start_tutorial | Employee_Start_Admin_20210101_to_20211130 |
employee_exit_tutorial | Employee_Exit_Admin_20210101_to_20211130 |
organization_hierarchy_tutorial | Organization_Hierarchy_Admin_20210101 |
We can also check the Columns tab to ensure all the expected columns have been loaded and that each column has the correct data type. In this tutorial, we want to look at the columns to familiarize ourselves with the sample data.
Create a project
Next, we need to create a project in Studio to hold our work. Projects are how Visier handles version control, allowing you to define and edit the solution separately from the current production version of the solution. For more information, see Projects.
- On the global navigation bar, click Projects.
- In the Projects room, click New Project.
- In the New Project dialog, type a name and description for the project. We can name our project Visier Data with a description of Deliver people analytics at scale.
- Click Create.
The project home appears.
Create a data category
Now that we’ve created a project, we need to create a data category for our data. A data category represents a dataset loaded into Visier that runs on a unique data load frequency.
Each data category has its own set of instructions to generate a data version. A data version is an instance of uploaded data with a unique release number. For more information, see Data Versions.
The “instructions” within a data category bring together the mappings from source data to objects in Visier's analytic model.
- In the project, on the navigation bar, click Data > Data Categories.
- Click Create Data Category.
- Type a display name and description. We can name our data category Visier Data with a description of Instructions to load data.
- Click Create.
Result: The data category is created.
After a new data category is created, Visier generates a new tenant setting, Tenant_Design_0. Tenant settings define information about the tenant, including the data start and end dates. This tenant setting should be automatically assigned to the data category.
Check that the tenant setting is assigned to the data category:
- In the data category, click the Settings tab.
- Under Tenant setting, ensure Tenant_Design_0 is selected.
Now that you've loaded data, we will show you how to create mappings for each source. This will connect the source files' columns to the properties in Visier's analytic objects. We will then show you how to run a job to generate a data version.
Create mappings
Next, we need to create mappings for each of our sources. Mappings connect the source files' columns to the properties in Visier's analytic objects. For more information, see Mappings.
The following section contains tables to guide you through the mapping options. The source names will be different depending on how you loaded the sample data (file upload or data connector).
Let's start with our employee data and create a mapping for our employee source.
To create a mapping:
- In the project, on the navigation bar, click Data > Mappings.
- Click Create Mapping.
- In the Create mapping dialog, select the data category you created. In this tutorial, we named our data category, Visier Data.
- In Mapping type, select the appropriate mapping type. In this tutorial, we will select Regular for all the mappings. For more information about mapping types, see Add a Mapping.
- Type a display name and a description for the mapping. We can name our mapping Employee Mapping with a description of Data extraction rules for the employee analytic object.
- Select the source and its corresponding data load target. Because we're starting with our employee data, we will select employee_tutorial or Public_Employee_GH as our source and Employee as our data load target. The following table describes which data load target we will be selecting in this tutorial.
Source (File Upload)
Target
employee_tutorial
Employee
employment_start_tutorial
Employment_Start
employee_exit_tutorial
Employee_Exit
organization_hierarchy_tutorial
Organization_Hierarchy
- In Data type, select the correct data type for the source. In this tutorial, our employee data is Transactional profile. The following table describes which data type we will be selecting in this tutorial.
Source (File Upload)
Data Type
employee_tutorial
Transactional profile
employment_start_tutorial
Conception event
employee_exit_tutorial
Termination event
organization_hierarchy_tutorial
Transactional profile
Note: The data type is dependent on how the source data is formatted. For more information about mapping data types, see Add a Mapping.
- In Override behavior, select the correct override behavior for the mapping. The override behavior defines how the loader uses newer records to overwrite older records. For more information, see Add a Mapping. In this tutorial, we will use the default override behavior for each mapping.
- Click Create.
Result: The mapping is created.
After we create mappings for the rest of our sources, it's time to configure each mapping.
Configure mappings
Once we have created our mappings, we need to map the source columns to the analytic object properties. This can be done by utilizing the automap feature which streamlines the mapping process through string matching.
Let's start with our employee mapping.
- In Mappings, select the mapping that you want to configure.
In the mapping, click Automap
 .
.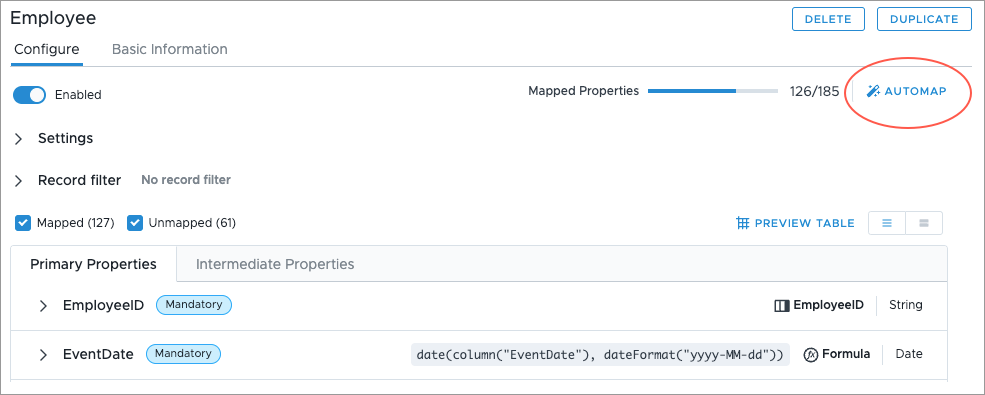
Result: The properties with matching source columns are mapped.
- In Properties, check the mapped items to ensure all your source columns were correctly mapped to a property. A property is mapped correctly if it shows the correct source column name or formula. For example, EmployeeID is mapped to the EmployeeID column and not the Birth_Date column. You can preview the records in the mapping by clicking Preview.
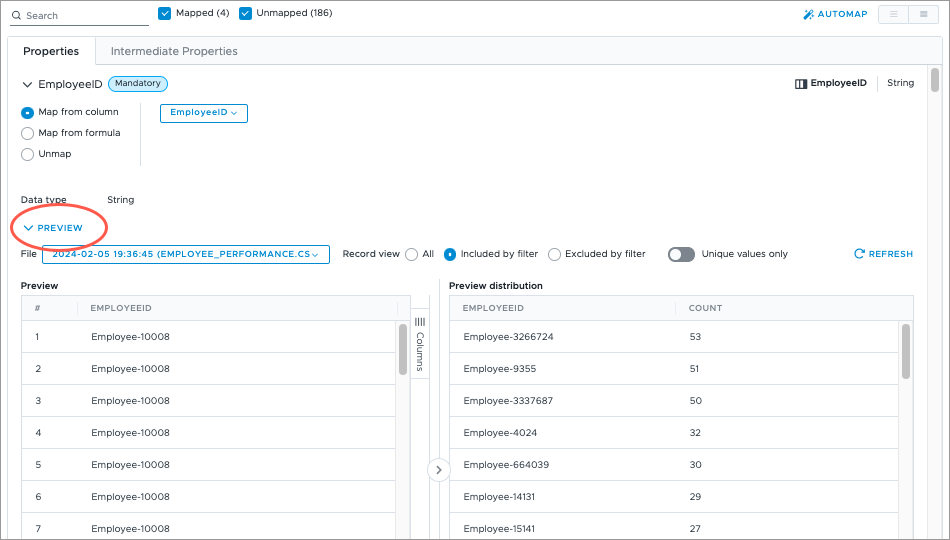
Once we're satisfied with our employee mapping, we will have to configure the rest of the mappings to map the source columns to the analytic object properties.
Add business rule
In this tutorial, our employee data is transactional. To correctly use this data in Visier, we need to create a business rule that create profiles from transactions, which will ensure the headcount is correct when we validate the data.
What is transactional data?
Transactional profile is a hybrid of temporal and transactional log types. The data excludes any unchanged records and includes each changed record in its entirety. The data is wide, where each row is included if one or more attributes have changed. The time associated with the change is included in the record.
Transactional data, both log and profile types, are less verbose than temporal data and require more data business rules to create system events. To determine what type of data you're loading, see Add a Mapping.
To add a business rule:
- In the project, on the navigation bar, click Data > Rules.
- In the Business Rules tab, click Create Rule.
- In the Create rule dialog, in Data category, select the data category you created. In this tutorial, we named our data category, Visier Data.
- In Rule type, select Business rule.
- Select the subject for the business rule. In this tutorial, we are selecting Employee as the subject of the business rule.
- Type a display name and description. We can name our business rule Employee Conception and Termination Rule with the description Create profile conceptions and terminations based on events.
- In Formula, type call createProfilesForCTEvents. This generates profile conception and termination events from actual conception and termination events.
- Click Create.
- Select the business rule we created, in the Configure tab, click Validate.
Run a job to generate a data version
Once we've created and configured our mappings, it's time to run a job to generate a new data version, this will allow us to preview the data in the solution. Jobs define the tasks needed to load your data into Visier. For more information, see Jobs.
- In the project, on the navigation bar, click Data > Data Categories.
- On the data category we created for our data, in the Actions column, click the More button
 . In this tutorial, we named our data category, Visier Data.
 - Click Run job.
- In the Configure Data Loader dialog, click Run job. In this tutorial, we'll use the default job settings.
To check the status of the job, navigate to Data > Jobs.
- In the Status tab, click Refresh. The job should now appear in the list.
If successful, a release number appears in the Data Version column. This means a data version is generated and the job is complete.
Check that data is available in the solution
Now that we've generated a data version, we need to confirm that data has been loaded for employee, employment start, employee exit, and organization hierarchy.
- In the project, on the navigation bar, click Model > Analytic Objects.
- In the list of analytic objects, search for Employee.
Check the Data Available column. If the column reads Yes, then we've successfully loaded data for the analytic object.

- Repeat steps 2 and 3 to confirm data has been successfully loaded for Employment Start and Employee Exit.
- In the project, on the navigation bar, click Model > Dimensions.
- In the list of dimensions, search for Organization, and then confirm data is available for the organization hierarchy object.
Commit project changes
Now that we've confirmed that data has been loaded, it's a good time to commit our changes. Committing changes acts as a save point for your project.
- In the project, on the navigation bar, click the Home button
 .
. - Click the Changes tab in the project home.
- Click Commit All.
- In the Commit Changes to Project Revision dialog, type a name and description for the project revision. We can name our revision Initial Data Load with a description of Generated data version.
- Click Commit now.
Configure concepts
After successfully loading data in Visier and generating a data version, the next step involves configuring concepts. This is an important part of onboarding data into Visier because it gives meaning to your data. Setting up the analytic model through concept configuration defines how your data values align with concepts in Visier so that the platform represents your data appropriately. For more information about the analytic model, see Understand Visier's Analytic Model.
In this tutorial, you will learn how to configure a specific set of selection concepts and calculation concepts so that you can analyze employee data, starts and exits data, and organization hierarchy data. The configured concepts will provide data for the following pre-built metrics:
- Age
- Average FTEs
- Average Headcount
- Full-Time Equivalents
- Headcount
By the end of this tutorial, you will harmonize your data into concepts that allows you to view the following pre-built analyses:
- Employee Demographics
- Employee Exits
- Employee Starts
- Learn About Headcount and Demographics
- Learn About the Employee Exit Model
- Learn About the Employee Starts Model
Introducing the visual title and analysis context
As part of concept configuration, we will go through validation steps to confirm that the data is correct by comparing it against the source data. This will involve interacting with visualizations to change the data that is displayed.
Use the various elements to analyze your data and build a visual to suit your needs.
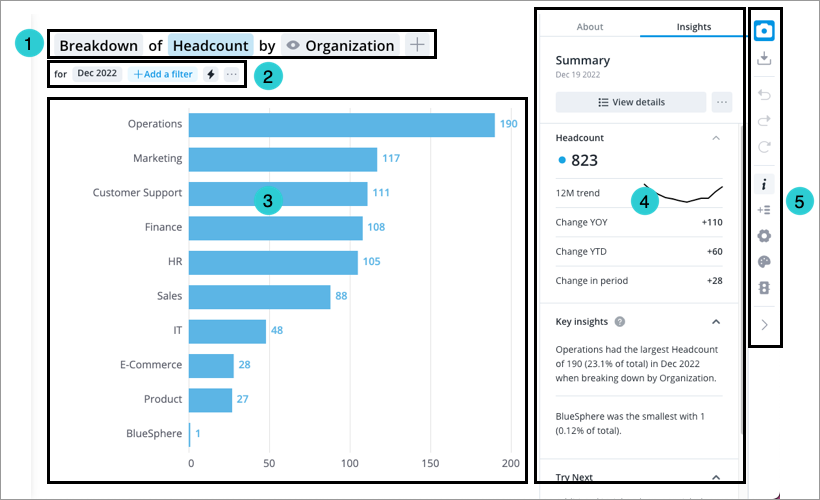
- Visual title: Describes and controls the data that is displayed in the chart. Click the Metric picker, Visual picker, and Group By picker in the visual title to change the data that is displayed. For more information, see The Visual Title.
- Analysis Context toolbar: Change the Analysis Context to select the population and time period for analysis. For more information, see The Analysis Context.
- Chart: Graphical representation of one or more metric.
- Side panel: View contextual information about selected metrics and data points, customize the appearance of your chart, and change chart configurations.
- Visual Actions menu: Use these quick access buttons to perform chart actions and open chart customization and configuration options in the Side panel. For more information, see Visual Actions Menu.
Figure out what needs to be configured
After loading data for the first time and generating a data version, you must map your data values to concepts in Visier. This allows us to start analyzing our data. Concept mapping is the definition of what your data means in Visier by configuring data values to align to concepts. The concepts that will need to be configured will depend on the objects in your Blueprint (the pre-built content that comes with Visier). In this tutorial, we will be configuring the following concepts to populate the pre-built content:
- Critical Employee
- Current Employee
- Employee Exit Model
- Employee Movement
- Employee Starts Model
- Full Time Employees
- Is Permanent Employee
- Majority (US)
- Man
- Minority (US)
- Top Talent
- Woman
Note: Depending on your data, there may be different dimension members available to select. In this tutorial, we will suggest certain selections based on the sample data, however, you can select any members you want.
Configure calculated selection concepts
First, we'll configure the only required calculated selection concept, Current Employee. For this concept, we need to change the selection type from Calculated to Member. By default, Current Employee is a calculated selection concept whose formula is true. This means that the concept will select all employees with data, not just employees who are considered "active" by your organization's definition. By changing to a member selection concept, we can define which values indicate an employee is currently active in the organization.
- In a project, on the navigation bar, click Model > Concepts.
- In the list of concepts, search for and select Current Employee.
- In Current Employee, navigate to the Customize tab.
- Select Member.
- In the Convert dialog, select Employee. Click Convert.
- In the Customize tab, in the Selected dimensions area, click Add Dimensions.
- In the Add Dimensions dialog, search for and select Employment Status, and then click Add.
- Navigate to the Configure tab.
- In the list of Employment Status members, select Active and On Notice. This means that if an employee in our data has an Employment Status of Active or On Notice, Visier will count them as a Current Employee.
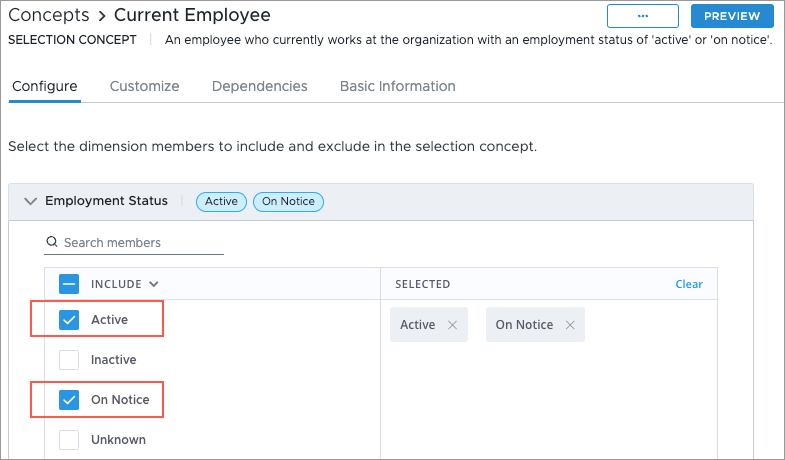
Result: The Current Employee concept is configured!
- To view your changes, click Preview. In the visualization, confirm that the data is correct by comparing it against your source data.
Configure member selection concepts
Next, let's configure the remaining member selection concepts. To configure member selection concepts, we need to select the values (called "members" in Visier) from our data and assign them to concepts.
Current Employee
If we assign the members Active and On Notice to the concept Current Employee, then all employees whose employment status is either Active or On Notice in our data will be included in the Current Employee group or filter when used in visualizations and analyses.
- In a project, on the navigation bar, click Model > Concepts.
- In the list of concepts, search for and select Is Permanent Employee.
- In Is Permanent, in the Configure tab, in the list of values, select TRUE. If an employee in your data has a Permanent status of TRUE, Visier will count them as a Permanent Employee, employees who are hired on a permanent basis.
Result: The Is Permanent Employee concept is configured!
To view your changes, click Preview.
- Repeat steps 2-4 for the following member selection concepts.
- Critical Employee: Select the member TRUE.
- Full Time Employees: Select the member Full-Time shifts.
- Majority (US): Select the member White.
- Man: Select the member Male and Transgender Man.
- Minority (US): Select the members Hispanic or Latino, Black or African American, Native Hawaiian or Other Pacific Islander, Asian, American Indian or Alaska Native, Two or More Races, and Unknown.
- Top Talent: Select the member TRUE.
- Woman: Select the member Female and Transgender Woman.
Configure calculation concepts
Next, we can configure the required calculation concepts: Employee Exit Model and Employee Starts Model. To configure calculation concepts, we need to select the values (called "members" in Visier) from our data and assign them to the concept's hierarchy nodes. For more information about calculation concepts, see Concepts.
- In a project, on the navigation bar, click Model > Concepts.
- In the list of concepts, search for and select Employee Exit Model.
- In Employee Exit Model, in the Configure tab, select the following members for each exit type (hierarchy node):
- Disability Exit: Don't select any members.
- Maternity Exit: Don't select any members.
- Other Involuntary Turnover: Select the members Involuntary Performance, Involuntary Position, and Other exit.
- Other Voluntary Turnover: Don't select any members.
- Reduction in Force: Don't select any members
- Resignation: Select the member Resignation.
- Retirement: Select the member Retirement.
- System Termination: Select the members System Termination.
- Termination: Don't select any members.
- To view your changes, click Preview. In the visualization, change the visual type to Breakdown, select the Employee Exit Count metric, change the time granularity to Years, and change the time period to 2021. Then confirm that the data is correct by comparing it against your source data.
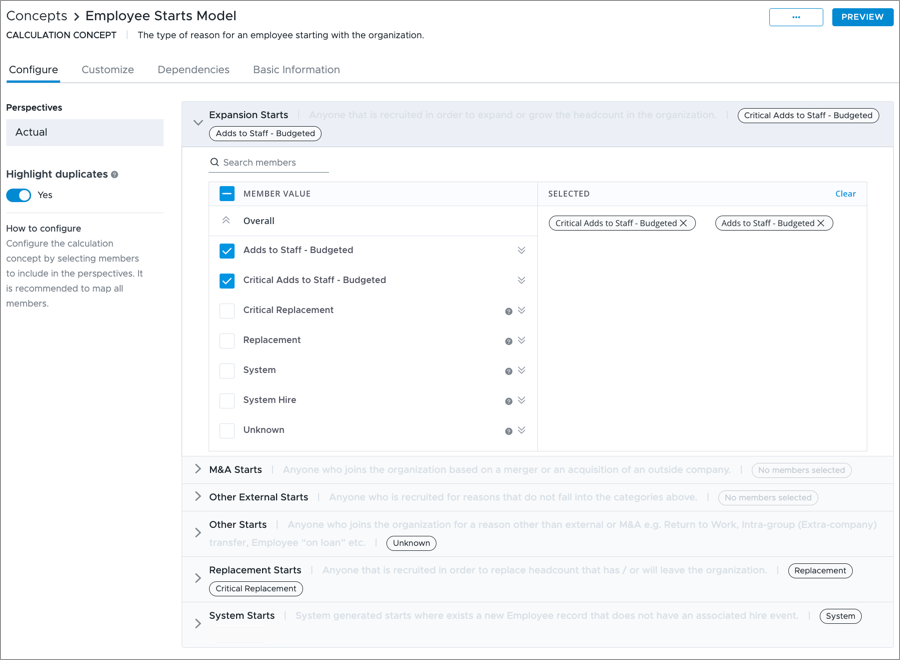
- Close the preview and return to the Concepts room. In the list of concepts, search for and select Employee Starts Model.
- In Configure, select the following members for each start type:
- Expansion Starts: Select the member Adds to Staff - Budgeted and Critical Adds to Staff - Budgeted.
- M&A Starts: Don't select any members.
- Other External Starts: Don't select any members.
- Other Starts: Select the member Unknown.
- Replacement Starts: Select the members Critical Replacement and Replacement.
- System Starts: Select the member System.

To view your changes, click Preview. In the visualization, change the visual type to Breakdown, select the Employee Starts Count metric, change the time granularity to Years, and change the time period to 2021. Then confirm that the data is correct by comparing it against your source data.
Configure movement concepts
Next, we can configure the required movement concepts: Employee Movement. To configure movement concepts, we need to select the dimensions which will track moves in, out, and within your selected population. If no dimension is configured, all movements will be counted in "Others in/out". For more information about movement concepts, see Concepts.
- In a project, on the navigation bar, click Model > Concepts.
- In the list of concepts, search for and select Employee Movement.
- In Employee Movement, in the Configure tab, select the following dimensions for each movement type:
- Move in/out dimensions: Select the dimensions Location and Organization.
- Move within dimensions: Select the dimensions Location and Organization.
- To view your changes, click Preview. In the visualization, change the time granularity to Years and change the time period to 2021. Then confirm that the data is correct by comparing it against your source data.
Preview and validate in the solution
Now that we've configured all the necessary concepts, let's double check that the data for employee, employment start, employee exit, and organization hierarchy is being shown accurately in the solution. This is done by previewing the data in the solution in either the Guidebooks room or Explore room.
- The Guidebooks room is where you can view pre-built analyses to get insights into your business questions.
- The Explore room is where you can conduct most of your ad hoc analysis in the solution and customize visuals to suit your needs.
For this tutorial, we will preview and validate data in the Guidebooks room.
- In the project, on the navigation bar, click Preview Solution.
Result: The analytics solution opens in preview mode.
- On the navigation bar, click Guidebooks and then click the Get Started topic.
- Click the Application Overview analysis.
- Scroll through the analysis to ensure the visualizations are populated with data and no error messages appear.
- Verify the solution data matches our source data.
After we verify the solution data matches our source data, we have successfully set up the analytic model.
Commit project changes
Now that we've successfully set up the analytic model, it's a good time to commit our changes. Committing changes acts as a save point for your project.
- In the project, on the navigation bar, click the Home button
 .
. - Click the Changes tab in the project home.
- Click Commit All.
- In the Commit Changes to Project Revision dialog, type a name and description for the project revision. We can name our revision Concept Configuration with a description of Finished set up of analytic model.
- Click Commit now.
Publish the project
Now that you've loaded data and set up the analytic model, the next step is to publish your project so your changes are available in production. In this tutorial, you're essentially publishing your people analytics solution for the first time. If you choose not to publish, only you and anyone with access to the project can see data.
- In the project, on the navigation bar, click the Home button
 .
. - Click the Changes tab in the project home.
- Commit any uncommitted changes.
- Click Release to Production in the upper-right corner of the project.
- In the Release to Production dialog, type a name, description, and release version, and then click Release now. We can name our release Visier V1.0 with the description Initial release.
A new production version of the solution is created.
Explore the data
Now that you've published your project, navigate to the solution experience to explore your people analytics solution.
Navigate to the solution experience
To navigate from Studio to the solution experience:
- On the global navigation bar, click Projects.
- Hover over the Production project and click the View Solution button
 . In this tutorial, the Production project is named Visier V1.0.
View pre-built content in the Guidebooks room
The Guidebooks room is where you can view curated content created by Visier's experts or customized content built by your organization. The content within a guidebook is a collection of related topics and analyses that provide insight into business questions and workforce data.
To access the Guidebooks room, on the navigation bar, click Guidebooks ![]() .
.
Within the Guidebooks room, individual guidebooks appear as different sections.
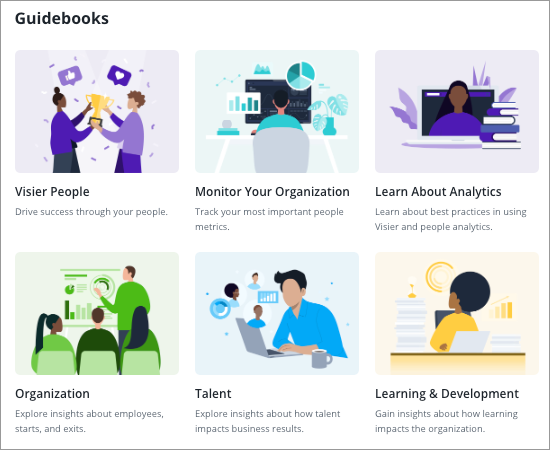
Once you click into a guidebook, you will see a list of related topics. Topics are categories used to organize a collection of analyses. Each topic contains at least one analysis.
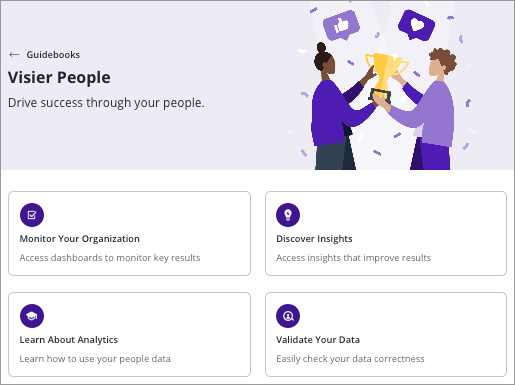
The analyses in the Guidebooks room are designed to answer complex business questions by telling viewers a story with data visualizations. However, analyses can be designed and used in many ways. The pre-built content that is packaged with Visier includes dashboards that simplify and centralize key metrics and data points for various HR teams and Learn About analyses that walk readers through key people analytics topics to help them understand potential problem areas and investigate root causes.
As you can, a lot of valuable insights can be generated from a very limited data set that includes the employee profile and the starts and exit events.
Build visualizations in the Explore room
You can explore your data, generate your own insights, and build visualizations in the Explore room.
To access the Explore room, on the navigation bar, click Explore ![]() .
.
Use the various elements to analyze your data and build a visual to suit your needs.

- Visual title: Describes and controls the data that is displayed in the chart. Click the Metric picker, Visual picker, and Group By picker in the visual title to change the data that is displayed. For more information, see The Visual Title.
- Analysis Context toolbar: Change the Analysis Context to select the population and time period for analysis. For more information, see The Analysis Context.
- Chart: Graphical representation of one or more metric.
- Side panel: View contextual information about selected metrics and data points, customize the appearance of your chart, and change chart configurations.
- Visual Actions menu: Use these quick access buttons to perform chart actions and open chart customization and configuration options in the Side panel. For more information, see Visual Actions Menu.
Counting employees is a fundamental task in people analytics and Visier provides a Headcount metric that shows the number of active employees at a point in time. In the Explore room, you can analyze the Headcount metric using key attributes to understand the composition of your workforce and how it has changed over time.
To begin your analysis, select the Headcount metric.
- In the visual title, click the Metric picker, and select the Headcount metric.
Having the overall Headcount is handy, but you probably want to subdivide the data by an attribute to understand the composition of your workforce.
- In the visual title, click the Visual picker, and select the Breakdown visual to compare the number, frequency, or any measure of two or more related groups.
- In the visual title, click the Group By picker, and select Location to understand where employees work.
- Drill into different levels of your hierarchical data by double-clicking a chart item. For example, drill into region such as North America to see the countries where your employees work.
Focus your analysis and view Headcount for a specific population by applying filters.
- On the Analysis Context toolbar, click Add a Filter.
- Select one of the suggested filters such as Minorities to understand the distribution of protected employee classes throughout your organization.
There are many visual types that you can choose from to explore and represent your data.
- In the visual title, click the Visual picker and select Trend to see how the Headcount has changed over time.
For more information about the fundamental building blocks needed to create a visual and explore your data in Visier, see Build Visualizations.
Next steps
Now that your data is loaded, explore the following ways to leverage the platform and deliver actionable people insights throughout your organization:
- Deploy and manage your solution: Roll out your people analytics solution to the rest of your organization.
- Customize and expand: Tailor the analytic model to suit your needs.
- Get data out: Get insights out of Visier and analyze your aggregated data in third-party tools.
In this section
