External Benchmarks
Compare data about your own workforce against government sourced statistics.
Visier allows you to compare data about your own workforce against statistics released by different government organizations across the world. Use these external benchmarks to gauge organizational performance in areas like retention and diversity.
EEOC benchmarks
The US Equal Employment Opportunity Commission (EEOC) provides annual statistics on employment patterns and the representation of women and minorities within companies, industries, or regions. The EEOC collects data from private employers and government contractors using a compliance survey that is mandated by federal statute and regulations. All companies with 100 or more employees and contractors with 50 or more employees and a contract worth $50,000 or more are required to complete the survey. For more information about the statistics released by EEOC, go to the US Equal Employment Opportunity Commission website.
The EEOC data set shows diversity ratios for the working population in the US. The statistics are categorized by state and broken down to specific industries. It is one of the most detailed and timely data sets available for assessing the diversity of an organization relative to its peers.
Note:
- EEOC benchmark data is updated annually.
- The EEOC does not publish industry data for all locations. Download the EEOC benchmarks spreadsheet to see the benchmarks that are available in the solution. Look at a given year and location to determine if there are EEOC benchmarks available for your industry.
List of EEOC metrics and attributes
Metrics
You can explore the following EEOC metrics in the solution:
- Women Ratio - My EEOC Benchmark
- Women Ratio - Overall EEOC Benchmark
- Women Ratio Variance from My EEOC Benchmark
- Minority Ratio - My EEOC Benchmark
- Minority Ratio - Overall EEOC Benchmark
- Minority Ratio Variance from US EEOC
Note:
- The Overall EEOC Benchmarks show data for all industries. Use the Overall benchmarks to compare against other organizations in different industries.
- The My EEOC Benchmarks show data for your industry.
Attributes
You can group your data using the following attributes:
Ethnicity
- American Indian or Alaska Native
- Asian
- Black or African American
- Hispanic or Latino
- Native Hawaiian or Other Pacific Islander
- Two or More Races
- White
Function
- Administrative Support Workers
- Craft Workers
- Executive/Senior Level Officials and Managers
- First/Mid Level Officials and Managers
- Laborers and Helpers
- Operatives
- Professionals
- Sales Workers
- Service Workers
- Technicians
Gender
- Man
- Woman
Industry
- All Industries, listed by their NAICS two- and three-digit sector codes.
Location
- US
- All States
Frequently asked questions
Why do I see N/A values for EEOC benchmarks?
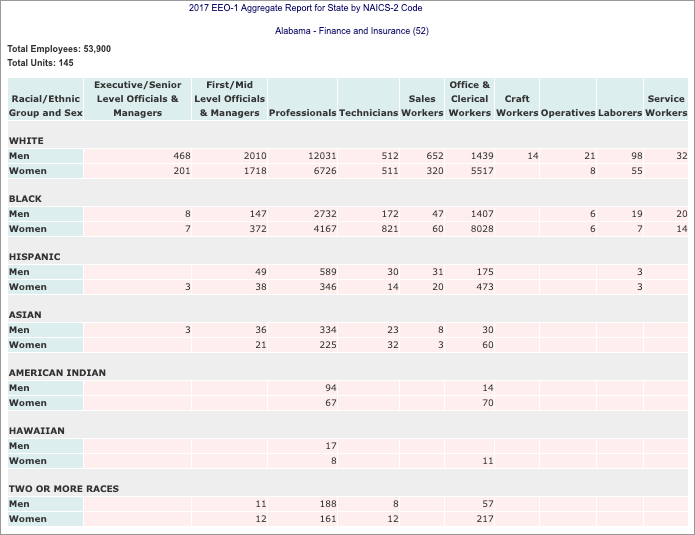
When working with EEOC benchmarks, you will see N/A values because the dataset that we use to calculate these benchmarks contain suppressed values. In 2016, the EEOC implemented statistical disclosure policies to protect the confidentiality of individual employees. As a result, the EEOC no longer publishes aggregated data for certain populations. The following dataset shows the number of employees in Alabama who worked in Finance and Insurance for 2017. Notice the amount of values that have been suppressed to protect employee confidentiality.

Previously, we could derive benchmark values for Women Ratio and Minority Ratio because we knew the exact employee counts across genders, ethnicities, and job functions. Now with the prevalence of missing employee counts, we won't be able to calculate benchmark values in many cases.

For example, to derive the Women Ratio for American Indian employees in the Finance and Insurance Industry in Alabama, we would add up the number of employees who are women of American Indian descent for each job function. However, this is not possible if the employee count for women has been suppressed for several job functions.
How do I navigate beyond the N/A values to gain insight?
Due to the amount of suppressed values in the EEOC dataset, we will not be able to derive exact overall benchmark values for every state, ethnicity, and job function. You can still see benchmark values at the lower levels by adding filters for specific locations, ethnicities, and job functions.
Do the EEOC benchmarks contain approximate values?
To ensure that our EEOC benchmarks continue to provide valuable insight, we used an approximation technique to fill in some of the missing values for the 2016, 2017, and 2018 datasets. Missing values were filled in using the following method:
- Determine the total number of employees that are missing from a given table (dataset provided by the EEOC).
- Approximate a benchmark value for populations that have a missing value.
- Calculate the relative error of each approximate value to assess its accuracy and to ensure that it's not too far off the true value. The true value is hypothetical and represents an ideal measurement with no errors.
- Publish a benchmark value if the relative error is 5 percent or less.
By using this approximation technique, we were able to reduce the number of missing overall employee counts by 40% for these datasets.
Unemployment benchmarks
There is a known relationship between employee exit rates and the local unemployment rate. Use the Unemployment Rate or Seasonally Adjusted Unemployment Rate metrics to see the percentage of the workforce who are not employed during the period. Then, compare your organization's employee exit rate with the local unemployment rate to determine how your organization is doing in terms of retention.
Note: The unemployment benchmark data is updated monthly.
Unemployment data is collected from the following sources:
| Location | Source |
|---|---|
| Australia | Australian Bureau of Statistics |
| Canada | Statistics Canada |
| European Union | European Statistics |
| Germany | Federal Bureau of Statistics |
| United Kingdom | Office for National Statistics |
| United States | US Bureau of Labor Statistics |
