
Understand Visier's Analytic Model
Learn the fundamentals of Visier's analytic model.
Overview
An analytic model is a system through which you can create meaning from raw data. With Visier's analytic model, you can pipe data from multiple sources into a single repository (Visier), which then generates all the elements you need to do your work, whether that's constructing charts and dashboards in Visier or a third-party app. The purpose of the analytic model is to simplify and organize your data, making it easier to work with.
In Visier's analytic model, your data is connected to objects. Visier objects are the items that contain your data and make it meaningful; for example, your employee data like Employee ID, Gender, and Start Dates are connected to a Visier object called Employee. The combination of your data and objects in Visier make your data more comprehensible and consumable.
Note: An object can be an analytic object (like a subject or an event) or an attribute (like a property or dimension). In this document, "object" is a generic term to describe a component of Visier's analytic model; if a specific object type is relevant (like "analytic object", "property", or "dimension"), the appropriate term is used.
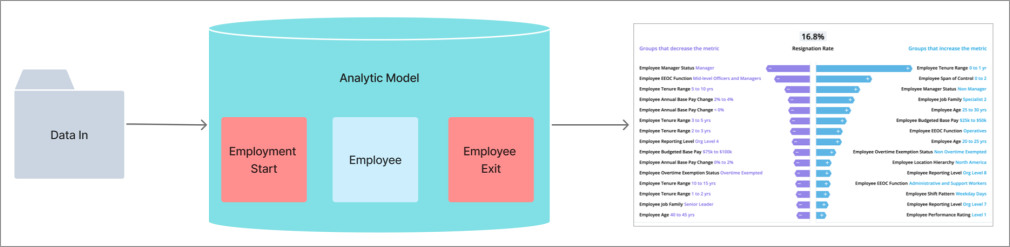
Let's say your organization has data for employee exits, gender, managers, education, and promotions. With Visier, you can load that data into the analytic model and then use it to determine drivers of resignation and the risk of resignation for specific employees.
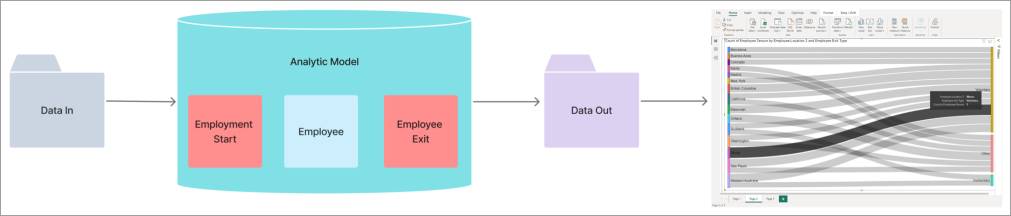
Alternatively, you can load that data into the analytic model and then get aggregated data out with Visier's out-of-the-box metrics, which you can then use in your preferred tools.
Visier's analytic model provides you with a huge library of content, right out of the box, known as the Blueprint. However, your organization may need more unique content. The good news is that many parts of Visier's analytic model are simple to customize, requiring no coding at all. For the more complex parts, like metrics, you can reuse existing metric formulas or learn Visier's formula language to build new metrics. For more information, see Work With Metrics.
In this article, you will learn terminology that is critical to understanding Visier's analytic model, starting with "analytic objects". By learning about the analytic model, you will be more prepared to customize and develop your analytic model to suit your organization's needs. For a list of terms, see Objects in Visier.
Tip:
- For a quick start guide to analytic objects and related objects, see Quick Start Guide: Terminology.
- To learn more, take the Visier University eLearning course: Understanding Visier's data architecture.
Analytic objects
Analytic objects are table-like items in Visier that contain specific data. These objects represent what you want to analyze or aggregate data for, like applicants, employees, pay change events, interviews, and even employee skills.

Analytic objects are organized into categories: subjects, events, overlays, and internal comparisons. In this article, we'll discuss the most important analytic objects: subjects and events.
Subjects
Subjects are the foundation of Visier's analytic model. Everything that you can do with Visier's analytic platform relies on the subjects in your Visier solution. Let's take the example of a people analytics application like Visier People®. In Visier People, whether you're analyzing performance, turnover, or drivers of resignation, you're doing aggregations, visual analysis, and data generation around the Employee subject.
Over time, the attributes related to a subject might change. For example, an attribute like Job Name might change every time an employee experiences a promotion or a move within the organization. Because a subject's attributes change, you can analyze a subject over time to determine its history, present, and potential futures.
After you have a subject to work with, you can start to add detailed data to that subject to build out the rest of the analytic model.
Properties and events
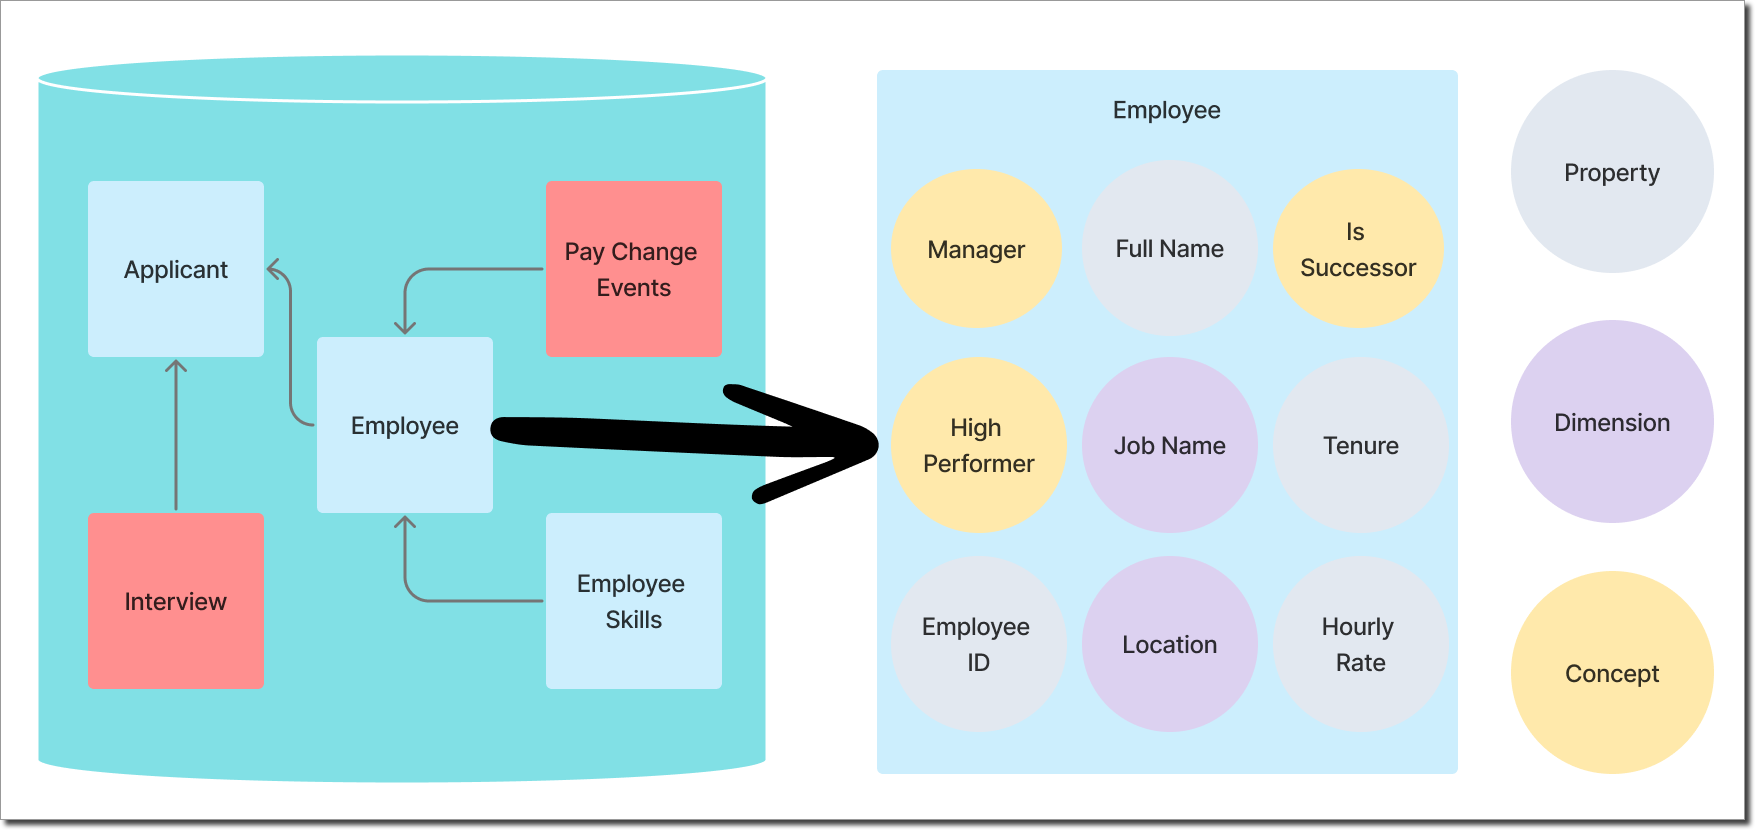
There are two objects in Visier that are vital to making subjects meaningful: properties and events. Properties and events contain detailed data about subjects. The following diagrams shows how different objects relate to the Employee subject.
Properties
Properties are attributes of analytic objects and describe values related to a specific record in an object. Let's take the example of Employee again. Employee is a subject (or analytic object) in Visier. You can add details to Employee with properties like Employee ID, Full Name, and Gender. A record in the Employee subject could be Brooke Davis. We don't know anything about Brooke until the properties contain data about her. Because we know Brooke's name, we can assume we already have Full Name data for her. Additional property data could be Employee-3 (her Employee ID), 60.44 (her Hourly Rate), Senior Data Scientist (her Job Name), and 9 years (her Tenure).
Brooke's data in your employee data file might look like this:
| EmployeeID | First Name | Last Name | Gender | Hourly Rate | Job Name | Employment Start Date |
|---|---|---|---|---|---|---|
| Employee-3 | Brooke | Davis | F | 60.44 | Senior Data Scientist | January 1, 2014 |
Events
Events are analytic objects that describe something that happened to a record at a particular instance in time. Events do not occur over time. In our example of Brooke Davis, some events could be Employment Start on January 1, 2014 and Pay Change Event on September 1, 2015. You can use events to analyze instance-based data, like employee exits.
The event data for pay events in your data file might look like this:
| Event Date | EmployeeID | New Hourly Rate |
|---|---|---|
| 2015-09-01 | Employee-1 | 22.00 |
| 2015-09-01 | Employee-3 | 60.44 |
| 2015-09-01 | Employee-5 | 35.80 |
| 2015-09-15 | Employee-8 | 25.92 |
Because events happen at a specific moment in time, they have properties of their own to describe the event. Employment Start contains properties like Employee ID, Hire Date, Hire Type, and Position Code, which describe details about an employee's start.
Dimensions and concepts
Now that we have a subject along with its events and properties, we can develop that into meaningful analysis or aggregated data with dimensions and concepts. Dimensions and concepts are both attributes of analytic objects, meaning that they describe analytic objects in some form, as described next.
Dimensions
Dimensions are attributes that classify data and differentiate one data record from another, such as the who, when, where, and what of the data. Using loaded data in Visier, you can group subject members by specific values in their data. For example, the Location dimension groups employees based on where they live. A column in the employee profile is mapped to the Location dimension and the loaded values populate the dimension members. For the Location dimension, its dimension members are the locations where your employees live, like North America, Canada, Vancouver, and Toronto. In Visier, you can then analyze employees by location to gain insight into your workforce.
Concepts
Concepts are attributes that allow grouping and categorization. Concepts standardize information in your data by dividing the data into subsets and are not populated with unique data, but instead use dimension and property data to reclassify data into new categorizations. For example, your employee data might not include a "Generation" column, but the Gen X concept will find all employees whose Birth Date data fits into the definition of Gen X. Other examples of concepts are Employee Movement (the subsets of employees that moved in, out, or within the organization), Applicant Process (the subsets of applicants that are in which stage of the job application process), and First Year (the subset of employees that have been with the company for less than one year).
Concepts are useful for data analysis by acting as filters in your data. Let's say you want to look at your entire workforce, but you want to know about a specific characteristic that some employees share, like those who are managers. In Visier, the Manager concept uses the Manager Status dimension to determine whether an employee is a manager or not. When the concept is calculated, you're able to filter your analysis to a manager-only population.
Metrics
In Visier, metrics calculate a business concern that can be quantified as a number. Let's say your business concern is the ratio of men to women in your organization. You can create a metric whose formula calculates the percentage of men to women in your current workforce.
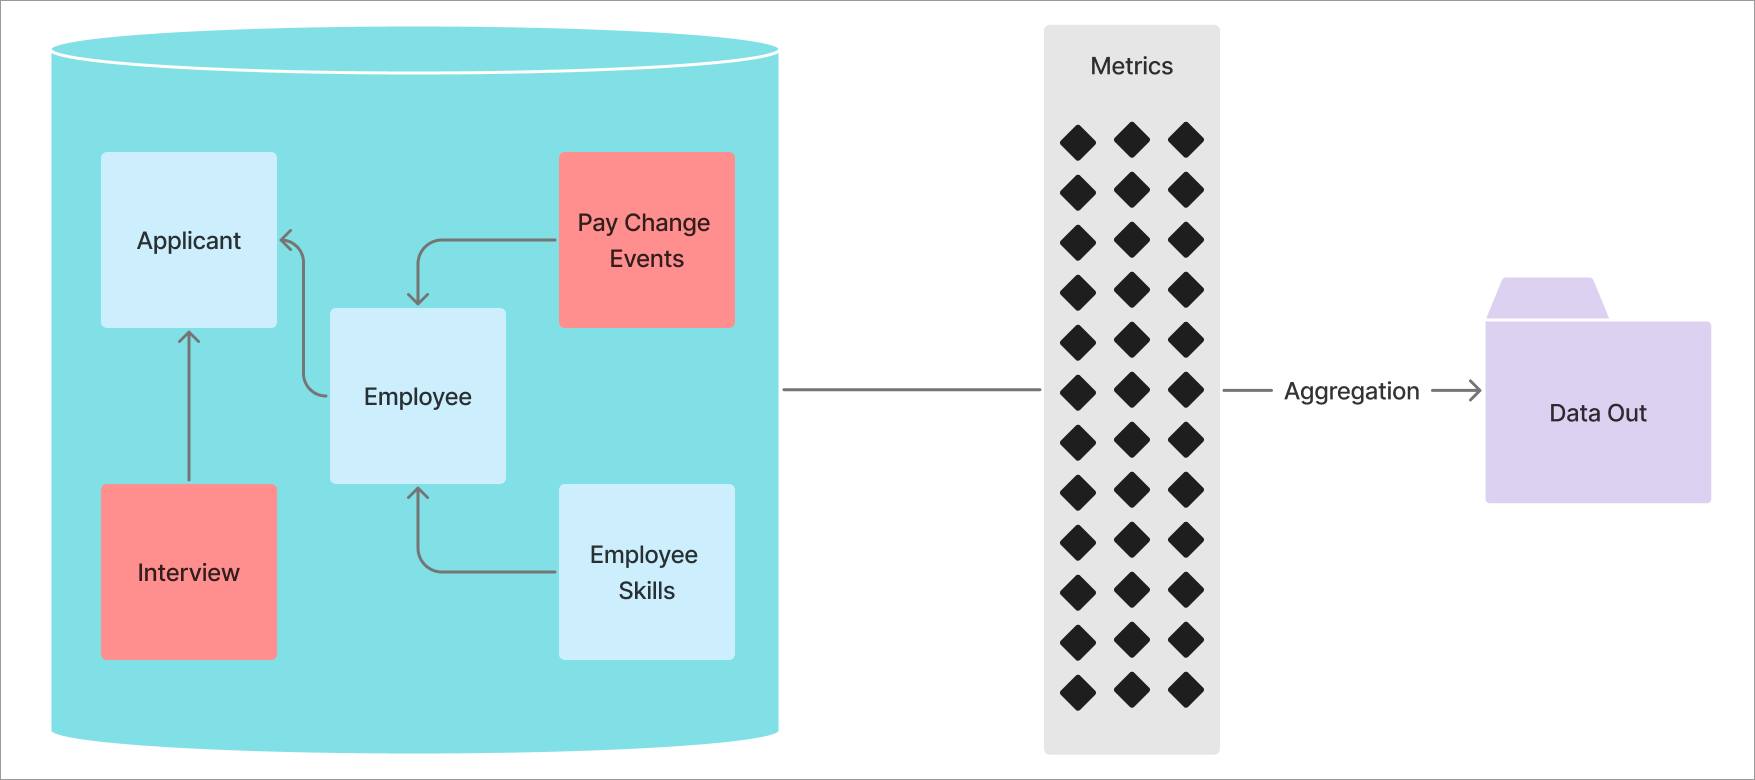
Metric formulas perform calculations on analytic objects and their attributes (like properties, dimensions, and concepts) and always contain an aggregation function like SUM or AVERAGE. The following diagram shows how analytic objects like Applicant, Employee, and Pay Change Events are used in various metrics to perform aggregation on the data, which is then available to get the aggregated data out of Visier for use in third-party apps.
Up next
Ready to start creating and customizing the model? Check out these resources:
Caution: If you end up changing objects in Visier's Blueprint, like subjects or dimensions, that may impact your ability to receive Blueprint updates from Visier. For more information, see Blueprint Inheritance.
Ready to start loading data into Visier to populate the analytic model? Check out these resources:
Have everything you need and now want to get data out of Visier? Check out these resources: