
Analyses
Shape your data into a well-crafted story that will engage and persuade key stakeholders.
Overview
Analyses allow you to shape your data into well-crafted stories, dashboards, or collections of related charts that you can share with your stakeholders. Analyses are interactive and automatically personalized to only show users the data they are allowed to see. You can also schedule and deliver analyses straight to your users' inboxes so they can get insights without having to log on to the app. For more information about authoring an analysis, see Create an Analysis.
Data-driven narratives
Tip: Watch this video to learn how to navigate the analyses in the Guidebook.
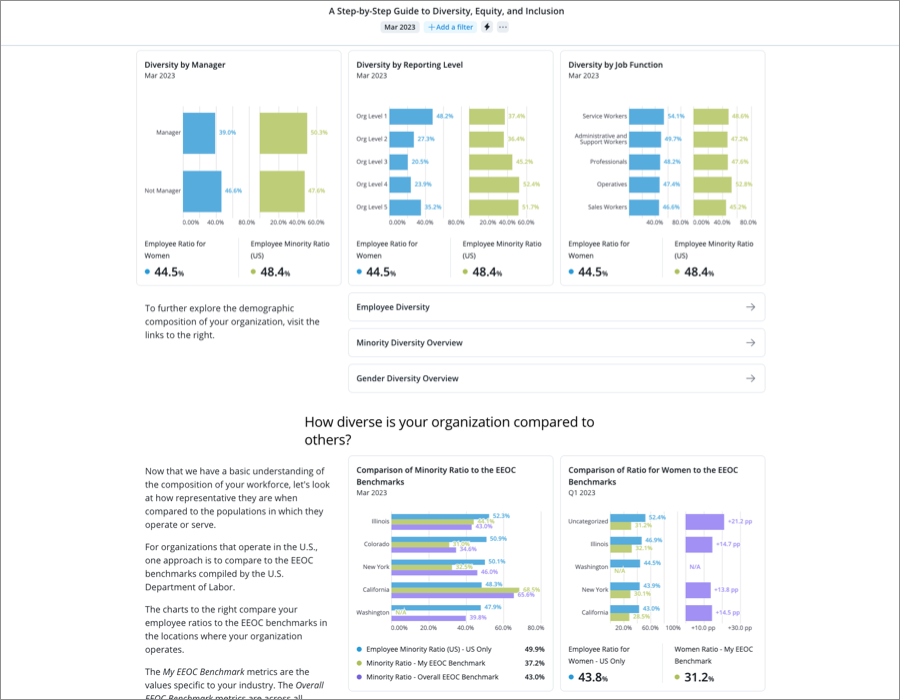
The analyses in guidebooks are designed to answer complex business questions by telling viewers a story with data visualizations. The typical analysis is made up of business questions (headers), charts, text, and links to other analyses, as shown in the following illustration.
Analyses as dashboards
You can also turn your analysis into a dashboard that lets you monitor multiple metrics at once, so you can quickly evaluate how your company is performing. A dashboard is more condensed with less white space, allowing you to fit more data on the screen, as shown in the following illustration.
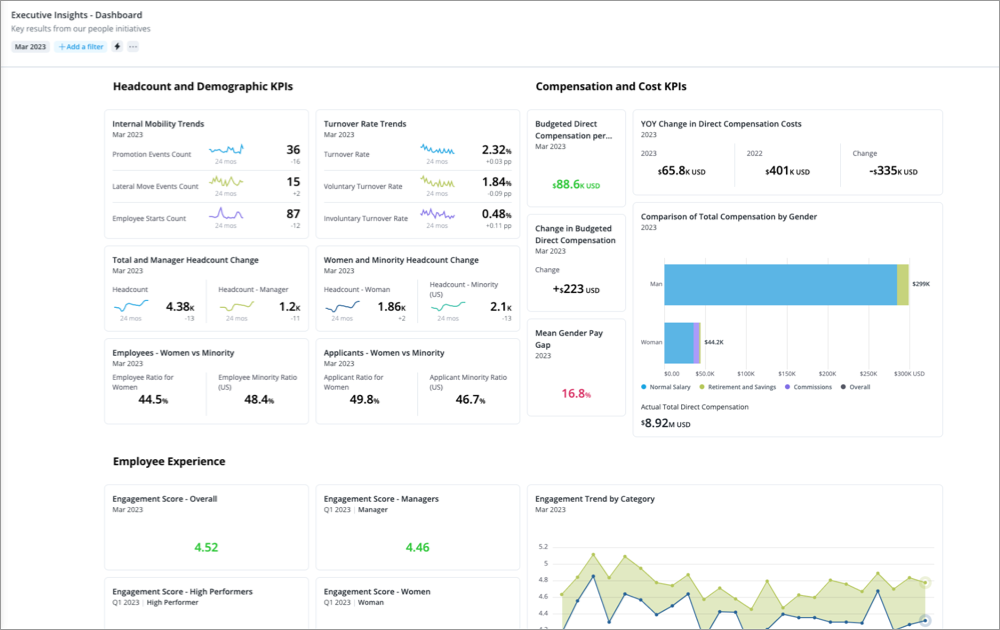
Note: To ensure your dashboards are always up to date and displaying the latest data, make the analysis dynamic and remove the time period context from the charts in the analysis.
The Analyses room
To access Analyses, on the navigation bar, click Analyses ![]() .
.
The Analyses room is where you will find a list of the analyses that you have access to.
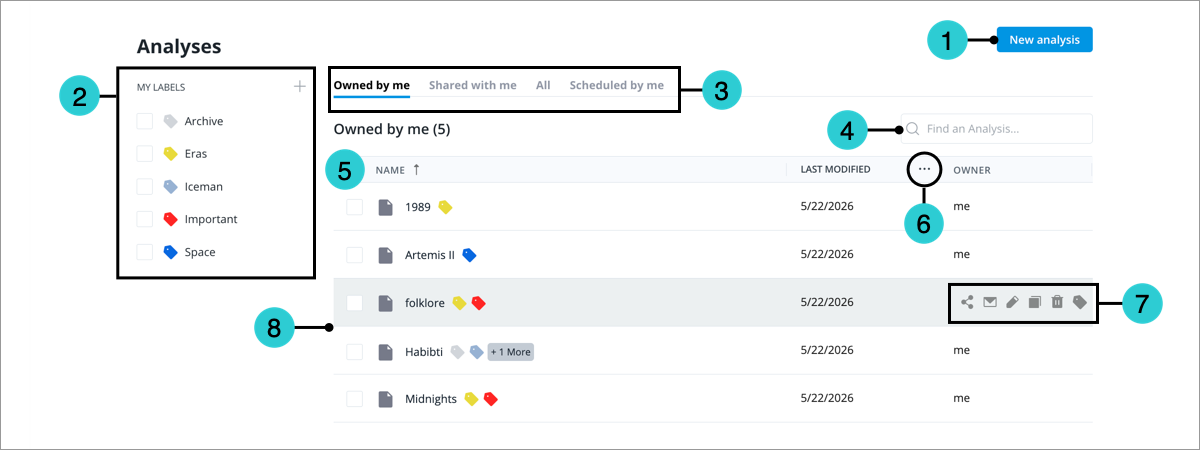
- New analysis: Open the Analysis Editor to create a new analysis. For more information, see Create an Analysis.
- My Labels: Select labels to quickly filter your list and surface the analyses you need. Create and manage labels to organize analyses into categories. For more information, see Label an Analysis.
- List view options: Switch between the tabs to view a list of all analyses you have access to, analyses that are owned by you, analyses that have been shared with you, and analyses that you've scheduled to be sent via email.
- Search: Find an analysis by typing the analysis name or the owner's name.
- Column headers: Click the headers to sort analyses in ascending or descending order by the analysis name, date, or owner's name.
- Date options: Select the information displayed in the Date column. You can show the last modified, last opened, or created date.
- Quick Actions: Hover over an analysis to reveal options to share, schedule, edit, copy, delete, and label the analysis.
- Analyses list: The list of analyses you have access to. Click to view an analysis.