
Group By
Select the attribute that is used to organize the data in your visualization.
Access requirements
Permission with these capabilities: Ad Hoc Analysis
Reach out to your administrator for access.
Overview
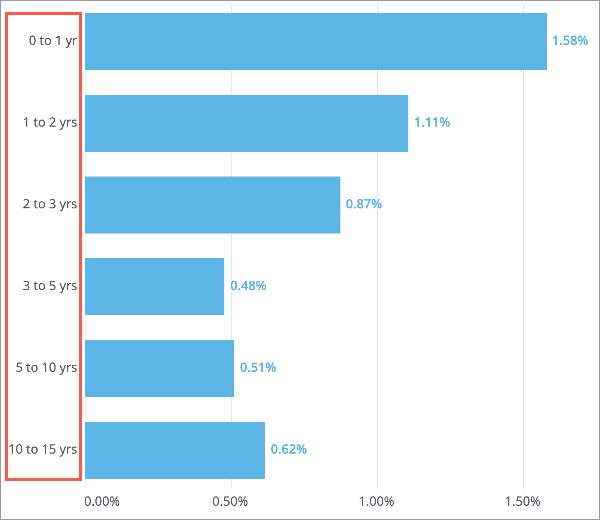
Group by is an action that subdivides the data (subject members or events) by an attribute. In this example, Turnover Rate is grouped by Tenure allowing you to see the percentage of employees who left the organization across the tenure ranges.
Note: Add focus to your chart to show data for specific attribute values that you are interested in. For more information, see Add Focus.
The Group By picker in the visual title is what you'll use to select the attribute.
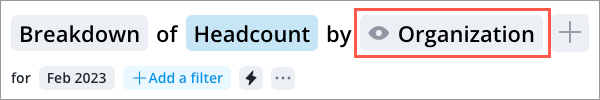
Note: Visuals such as the Breakdown visual and Relationship visual support more than one group by attribute. Click the Add button ![]() on the right side of the primary group by in the visual title to further subdivide your data.
on the right side of the primary group by in the visual title to further subdivide your data.
The picker views
The Metric, Filter, and Group By pickers have two different views.
When selecting these pickers, you'll be initially presented with a menu that contains a search box and list of suggested metrics or attributes, as shown in the following screenshot.
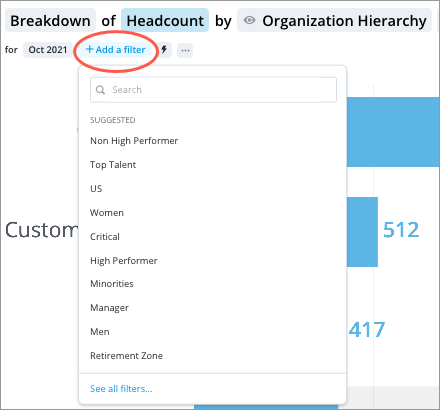
The suggestions are based on the metric or attribute that is currently selected.
You can see a list of recently used items by selecting the search box, as shown in the following screenshot. Only previously selected user created key groups and group by attributes will appear in the list of recently used filters.
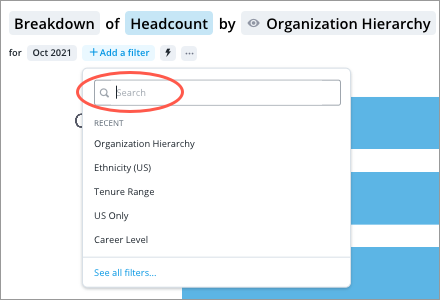
If you want to see the entire list of metrics or attributes that are available to you, click See all at the bottom of the picker.
In this dialog view, you can use the following panes to browse and select attributes:
- Categories pane: A list of the attribute categories. Select a category to see the included attributes in the Selection pane which is located on the right side of the picker.
- Selection pane: A list of the attributes in a category and where you choose an attribute.
Change the group by attribute
- In the visual title, click the Group By picker.
- Search for an attribute. You can also select a suggested or recently used attribute.
- Optional: To browse all attributes, click See all attributes.
Change the level of the group by attribute
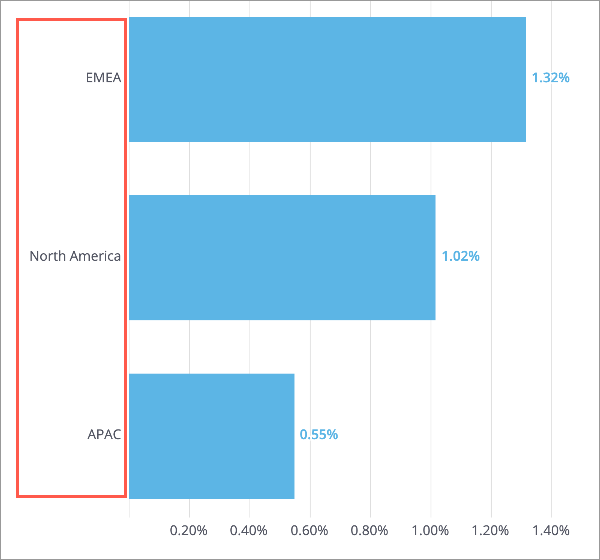
Attribute values can be arranged in multiple levels. For example, the Location Hierarchy may contain the following levels: Region, Country, State/Province, and City. By default, the visual will show groupings and attribute values from the top level. In this example, you can see Turnover data for each region such as North America and Asia Pacific.
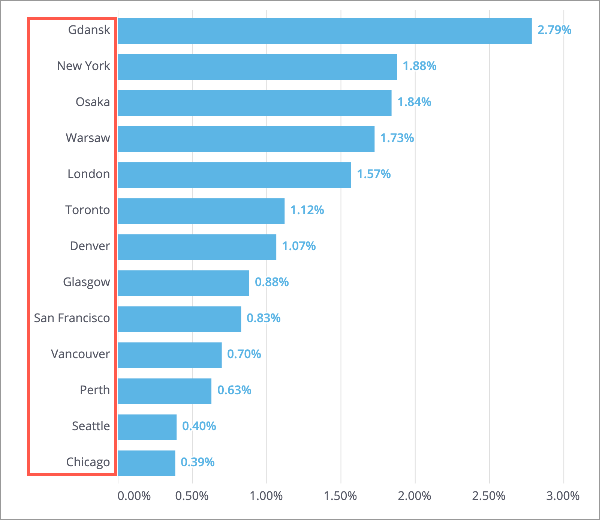
You can select a specific level to view all attribute values at that level. For example, you can select (group by) the City level to view Turnover data for each city such as New York, Vancouver, and London.
To change the level of the group by attribute:
- Ensure your visualization is grouped by an attribute that has more than one level such as Location Hierarchy.
- Click the Group By picker in the visual title, and click Select level of.
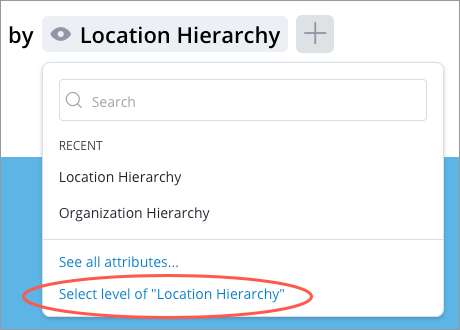
- Select the level of the attribute you want to group by in the Group By picker.
Tip: Select a visual item and drill through different levels of your data to reveal additional details. For more information, see Drill Down and Up in a Visual.
Note:
Change the reference path of the group by attribute
References are used to establish the relationship between analytic objects (subjects, events, or overlays) in the data model. These references join data from different tables allowing you to group or filter the population of one analytic object by the attributes of another.
Let's use the following subjects as an example:
- Applicant: Stores information about the applications for all your requisitions.
- Requisition: Stores information about open positions in your organization.
- Candidate: Stores information about the individuals in the candidate pool.
- Employee: Stores information about the current employees of your organization.
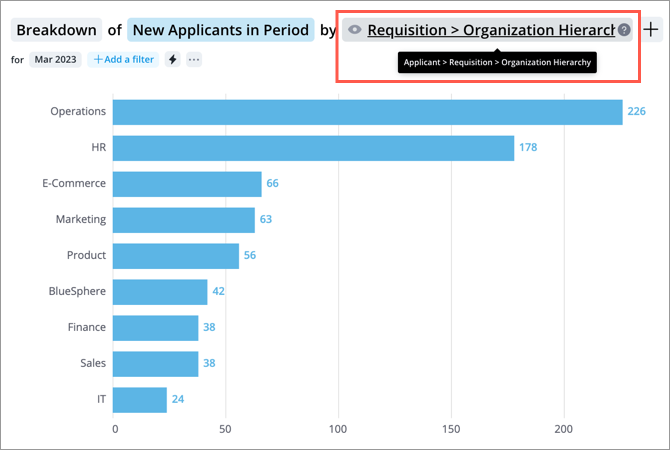
References are set up between these subjects that allow you to group Applicant metrics by Requisition, Candidate, and Employee attributes. When looking at New Applicants in Period by Organization Hierarchy. You can select the Organization Hierarchy attribute that uses the reference path, Applicant > Requisition > Organization Hierarchy to see the number of new applications that each department has received during the period.
If you want to see what department internal candidates are applying from, you can select the Organization Hierarchy attribute that uses the reference path Applicant > Candidate > Employee > Organization Hierarchy.
Reference paths become trickier when you compare metrics that are based on different analytic objects. When your visual contains more than one metric, the solution will automatically group the data by a common attribute and select the best reference path to the attribute (default). However, there are times where the reference path that is selected may not answer your business question. If this happens, you can change the reference path that the attribute uses for each metric in the visual.
To change the reference path in a visual that contains more than one metric and a single group by attribute:
-
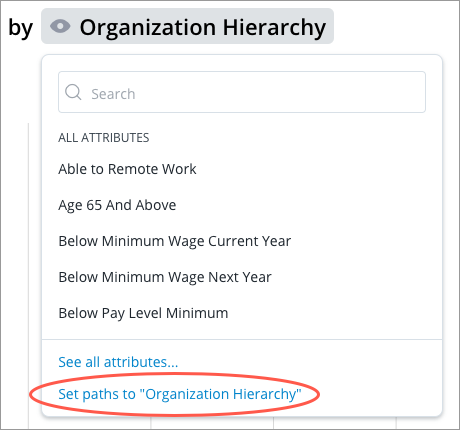
Click the Group By picker in the visual title and click Set paths to.
-
Select the reference paths for each metric in the Set paths to dialog.
- When finished, click Apply.
Limitations
- You can only change the reference path of attributes used in a group by.
- To use the default reference path, it must be applied to all metrics in the visual.
- You can not drill up or down in a visual after you change the reference path to something other than the default.
- Reference paths do not carry over when you change the metrics in the visual.
- Only common attributes that have a strong reference will appear in the search results of the Group By picker. For example, you're looking at Headcount grouped by Organization Hierarchy, an attribute on the Employee subject. Next, you add a Candidate metric for comparison such as External Candidates. In this example, the Employee subject is not a strong reference of the Candidate subject. Organization Hierarchy does not exist on the Candidate subject so it does not appear in the search results. The comparison visual still appears as the solution selects the best reference path to the attribute.