Validate Metric Values Using Metric Lineage
Understand and validate the values you encounter while working with metrics.
Access requirements
Custom profiles with one of the following capability sets:
- Model (Read, Simple) and Write access to any profile capability
- Model (Read, Simple) and any of the following additional capabilities: Settings, Manage Jobs, Translation, Content Reassignment, Data Validation - All Data
Data required: Access to all data such as the Super Admin permission
Reach out to your administrator for access.
If you run into an unexpected value while analyzing metrics, use the metric lineage tool to validate the data that is used in the context of the visualization. The sources that contribute to the metric values are listed subject to the user's data permission rights.
Note: To learn more about metrics and metric types, see Work With Metrics.
To access metric validation from a visualization:
- Click the Info button
 to open the Info panel.
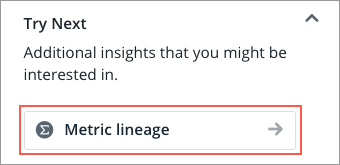
 - In the Insights tab, under Try Next, click Metric lineage, as shown next.
Result: A metric validation table opens. The columns in the table are specific to the context of your visualization and represent the attributes specified by the metric and any added filters.
- To open the Metric Validation panel, click the Metric validation button
 in the Info panel.
Tip: If you know the name of a person that you want to find in the table, click the Search bar in the Metric Validation panel, type the person's name, and press the Enter key on the keyboard to find them.
After you open the Metric Validation panel, you can validate your metric with the following methods:
- Filter the validation table to show records that are included in the context. For more information, see Explore included records.
- Select an individual record to view changes over time. For more information, see View the history of a record.
- Check that metric values are correct for compound metrics like rates and ratios. For more information, see Validate compound metrics.
- Check that metric values are correct for aggregate over time metrics like averages. For more information, see Validate aggregate over time metrics.
Explore included records
The metric validation table shows all the records included in the context based on the selected metrics and filters.
Example: The metric validation table shows all the records included in the context based on the selected metrics and filters.
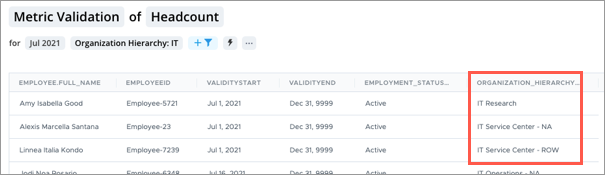
Let's say you're interested in the IT department at your organization. In the Explore room, you look at the Breakdown of Headcount by Organization Hierarchy filtered by Organization Hierarchy: IT and discover that the total number of active IT employees is 298. From there, you click Metric lineage in the Info panel to understand more about how the calculation came up with 298 employees in IT.
In the Metric Validation table, all the records are employees that are currently active and in the IT organization, as shown in the next screenshot.
View the history of a record
You can validate a specific record within a metric for records that change over time, such as when an individual moves to a different department within the organization.
To view the history of a record, do the following:
- In the table, hover over a record that experienced a change during the time context.
- At the right side of the row, click the View history button
 .
.Result: A History visualization opens that shows the history of the individual's attributes within the time context. For more information, see History Visual.
Example: Validating an internal movement
Let's say that you see an internal movement in the data that you weren't expecting. You can use the metric lineage tool to investigate the record and find out what happened.
In the Explore room, you look at the Breakdown of Internal Move Rate - Within Context by Organization Hierarchy filtered to the Marketing organization and discover that Gilbert Redondo had an internal movement that you didn't expect.
You hover over Gilbert's row in the table and then click the View history button on the right side of the row.
The History visualization opens and shows that Gilbert's Organization ID changed from West Field Marketing to Asia Field Marketing in October 2021, as shown next.
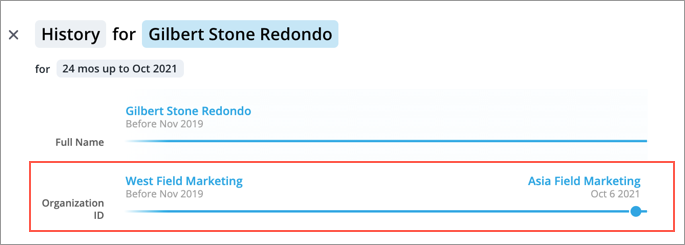
Now that you know what the change was, you can take action to correct the data, if necessary.
Validate compound metrics
If you're validating a compound metric, such as rates or ratios, you can select the metric on the numerator or denominator in the metric calculation—the leaf metrics—to view them individually in the metric validation table, as shown in the next screenshot for Manager Ratio.
To validate a compound metric, do the following:
- Open the Metric Validation panel .
- Under Select leaf metric, select one of the metrics.
Result: The table updates to show records relevant to the selected metric. In the bottom-left corner of the table, the total number of rows also updates to show the number of records in the table for the selected metric.
Example: Validating a ratio metric
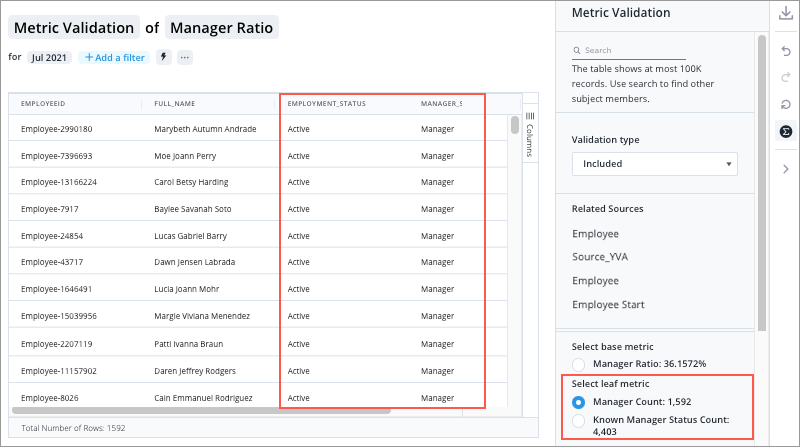
Let's say you're interested in the Manager Ratio at your organization. In the Explore room, you look at the Breakdown of Manager Ratio by Organization Hierarchy and discover that the ratio of active managers is 36.2% of the total employee population. From there, you click Metric lineage in the Info panel to understand more about how the calculation came up with 36.2% managers in your organization.
In the Metric Validation table, all the records are employees that are currently active and designated as Manager in the Manager_Status column. On the right-hand panel, you click the Metric validation button ![]() and review the leaf metrics, Manager Count (numerator) and Known Manager Status Count (denominator). You can see that Manager Count is 1,592 and Known Manager Status Count is 4,403, as shown next.
and review the leaf metrics, Manager Count (numerator) and Known Manager Status Count (denominator). You can see that Manager Count is 1,592 and Known Manager Status Count is 4,403, as shown next.
You can validate the value you saw in your original visualization by dividing 1,592 by 4,403 to get 36.2%.
Validate aggregate over time metrics
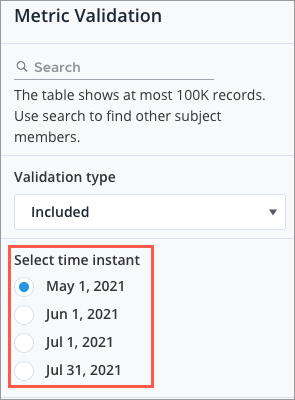
If you're validating a metric that is aggregated over time, such as averages, you can select the each of the time instants used to calculate the metric, as shown in the next screenshot for Average Headcount in July 2021.
To validate a compound metric, do the following:
- Open the Metric Validation panel .
- Under Select time instant, select one of the times.
Result: The table updates to show records relevant to the selected time instant. In the bottom-left corner of the table, the total number of rows also updates to the number of records in the table for the selected time instant.
Example: Validating an average metric
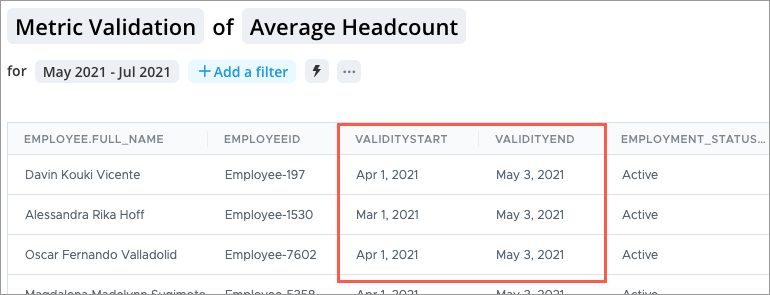
Let's say you're interested in the Average Headcount during May 2021 to July 2021 at your organization. In the Explore room, you look at the Breakdown of Average Headcount by Organization Hierarchy and discover that the average number of active employees during May 2021 to July 2021 is 4,146.5. From there, you click Metric lineage in the Info panel to understand more about how the calculation came up with an average of 4,146.5 employees in the organization during those months.
In the Metric Validation table, all the records are employees that were active on May 1, 2021, as shown in the next screenshot.
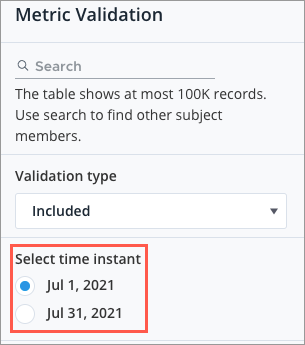
The metric validation tool automatically selects the first time instant in the selected context. In this example, the first time instant is May 1, 2021. In the Metric Validation panel, you can optionally select any of the other valid time instants from your time period, as shown in the next screenshot.
The footer of the table shows the total number of rows. This is the number of records for the selected time instant. If you add the values from each time instant and divide by 4 (the number of valid time instants for the selected time context), the final value should be the Average Headcount. In this example, the numbers are (4,209 + 4,146 + 4,124 + 4,107) / 4 = 4,146.5.
Example: Validating a nested query metric
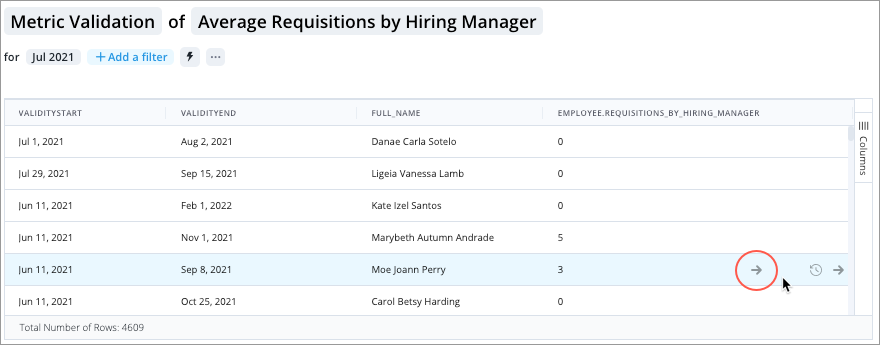
Let's say you have a nested query called Average Requisitions by Hiring Manager. This metric calculates the average number of requisitions that hiring managers are responsible for. The metric formula is on Employee validUntil instant aggregate average(Employee.Requisitions_by_Hiring_Manager).
In this metric, the nested query is a calculated property called Requisitions by Hiring Manager. This calculated property calculates the total number of requisitions each Hiring Manager is responsible for. The property formula is on Requisition via Hiring_Manager to Employee validUntil instant aggregate count(RequisitionID).
In the Metric Validation table, there is a column for the nested calculated property Requisitions by Hiring Manager, as shown in the following screenshot.
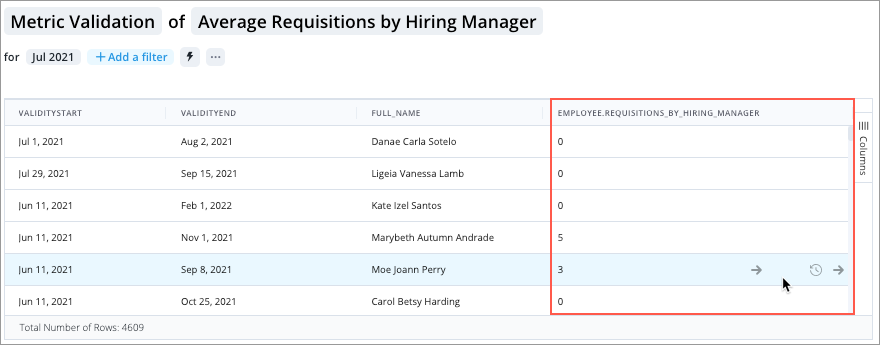
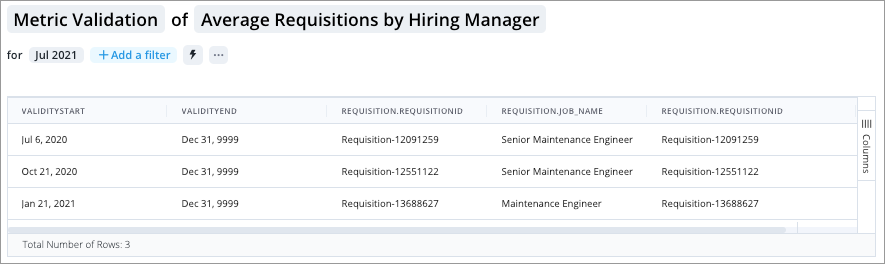
The values in the table are the aggregated values, and you can optionally drill down to see a more detailed view of the records being counted in the table, as shown in the following screenshots.