
The Visual Title
Describes and controls the data that is displayed in the visual.
Access requirements
Permission with these capabilities: Ad Hoc Analysis
Reach out to your administrator for access.
Overview
Tip: Watch this video to learn how to use the visual title.
The visual title is composed of the Visual picker, the Metric picker, and the Group By picker, as shown in the following screenshot.
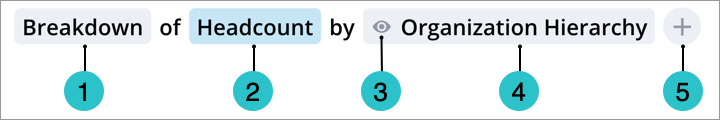
- Visual picker: Select the visual type for your chart. For more information, see Visual Types.
- Metric picker: Select the metric to be analyzed. For more information, see Metrics.
- Group By picker: Select the attribute that the data is organized by.
- Add focus: Select the attribute values that are displayed. Allows you to show or hide chart items. For more information, Add Focus.
- Add a Secondary Group By: Select an additional attribute that is used to organize the data.
Tip:
- When conducting ad hoc analysis, we recommend that you start by selecting the metric you want to analyze because the options available in the Visual picker and Group By picker depend on the metric that is selected.
- To ensure that a meaningful visualization is displayed, parts of the visual title will automatically change if an invalid selection is made.
-
The stacked bar chart is only available for additive metrics whose values for different populations can be summed to calculate a total value for the combined population.
- Headcount is an additive metric because you can add the headcounts of Group A and Group B to calculate a total.
- Resignation rate is not an additive metric because you cannot add the resignation rates of Group A and Group B to calculate a total.
The picker views
The Metric, Filter, and Group By pickers have two different views.
When selecting these pickers, you'll be initially presented with a menu that contains a search box and list of suggested metrics or attributes, as shown in the following screenshot.
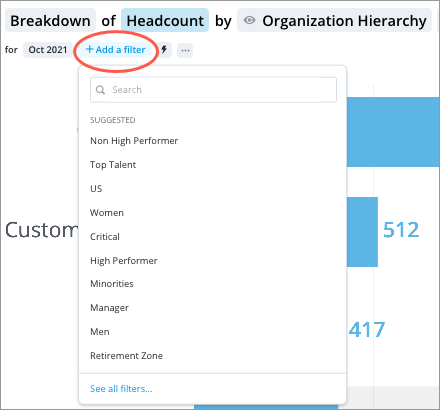
The suggestions are based on the metric or attribute that is currently selected.
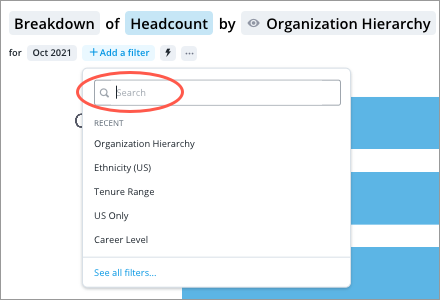
You can see a list of recently used items by selecting the search box, as shown in the following screenshot. Only previously selected user created key groups and group by attributes will appear in the list of recently used filters.
If you want to see the entire list of metrics or attributes that are available to you, click See all at the bottom of the picker.