How Plan Values Are Distributed
Changes to plan values at the parent level are automatically distributed to the lower levels of the plan.
Overview
By default, when you edit the value of a plan item at the parent level, the change in the plan value will be distributed to its children. However, if you have defined a calculation level, the change in the plan value will be distributed down to the segment you have selected for non-core plan items. For more information, see Calculation Levels for Plan Items.
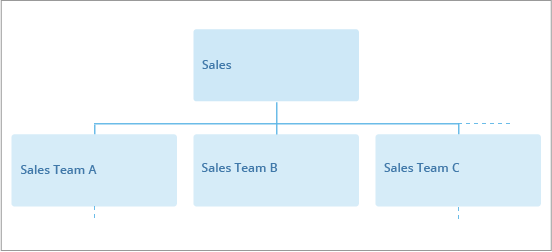
Imagine your Sales organization consists of the following organizations: Team A, Team B, and Team C. When you edit a plan value for the Sales organization (parent), the change in value will be distributed down to Team A, B, and C (children).
Distribution methods
Changes at the parent level will be distributed to the lower levels of your plan using one of the following methods:
- Constant Distribution: The parent value is inherited by its children, setting one value as the same for all child values. This distribution method is used for plan items that are rates such as Annual Resignation Rate.
- Change Ratio Distribution: The percentage change of the parent value is distributed to its children, keeping the proportions of the child values aligned. This distribution method is used for the Cost of Workforce plan items in the Headcount and cost planning model such as Direct Compensation.
- Weighted Distribution: The change in the parent value is distributed to its children based on their contribution to the plan item that is configured as the Weighting Plan Item. This distribution method is used for additive plan items that are counts such as Headcount and Added Positions.
Tip: You can quickly see the distribution method of a plan value in the Info panel.
Constant Distribution
Example A: Constant Distribution method
Let's say you change the plan value for Sales to 10%. The plan value will be inherited as follows:
| Team | Initial Plan Value | Final Plan Value |
|---|---|---|
| A | 20% | 10% |
| B | 30% | 10% |
| C | 50% | 10% |
Change Ratio Distribution
Example B: Change Ratio Distribution method
Let's say you increase the plan value for Sales by 20% from 100 to 120. The 20% increase in the plan value will be distributed as follows:
| Team | Initial Plan Value | Distribution Value | Final Plan Value |
|---|---|---|---|
| A | 20 | +4 (20 * 20%) | 24 |
| B | 30 | +6 (30 * 20%) | 36 |
| C | 50 | +10 (50 * 20%) | 60 |
Weighted Distribution
In some cases before the Weighted Distribution method is applied, an optimization step is performed to offset any projected gains or losses the children experienced from the previous period.
This optimization occurs when you:
- Decrease a parent value that is projected to increase from the previous period. Imagine a plan item is projected to increase from 150 to 200 from June to July. You think the projection for July is too high, so you decrease the plan value by 150, resulting in a final value of 50 (200 - 150). Because the parent value was projected to increase from June to July, some of the children may have received gains. To offset these gains, the change in plan value of 50 will be distributed to any child that received a gain. The value is distributed in order based on the amount gained from the previous period so the child who received the largest gain will get the first distribution. After the offset is complete, the remaining value is distributed using the Weighted Distribution method.
- Increase a parent value that is projected to decrease from the previous period. Imagine a plan item is projected to decrease from 150 to 120 from June to July. You think the projection for July is too low, so you increase the value by 80, resulting in a final value of 200 (120 + 80). Because the parent value was projected to decrease from June to July, some of the children may have incurred losses. To offset these losses, the change in plan value of 80 will be distributed to any child that incurred a loss. The value is distributed in order based on the amount loss from the previous period so the child who incurred the largest loss will get the first distribution. After the offset is complete, the remaining value is distributed using the Weighted Distribution method.
Note: The change in plan value may be fully distributed during the optimization step. As a result, the Weighted Distribution method will not be applied.
In this section we provide two examples for the Weighted Distribution method. Example C will help you understand how the Weighted Distribution method is calculated while Example D details the optimization step that may occur before the Weighted Distribution method is applied.
Example C: Weighted Distribution method
Imagine the Headcount of the Sales organization is 150 and broken down as follows:
| Team | Headcount | Percentage of Total Headcount |
|---|---|---|
| A | 15 | 10% (15 / 150) |
| B | 30 | 20% (30 /150) |
| C | 105 | 70% (105 / 150) |
Let's say you increase the plan value for Sales by 10. If the distribution method for the plan item is weighted by Headcount, the increase of 10 in the plan value will be distributed as follows:
| Team | Initial Plan Value | Distribution Value | Final Plan Value |
|---|---|---|---|
| A | 20 | +1 (10 * 10%) | 21 |
| B | 30 | +2 (10 * 20%) | 32 |
| C | 50 | +7 (10 * 70%) | 57 |
Note:
- The change in plan value is distributed in order of the child's contribution to the Weighting Plan Item. In this example, we first calculate and distribute the value to Team C because it has the highest Headcount weight of 70%). We would then distribute the rest of the value to Team B and then finally to Team A. In some cases due to rounding, the value may be fully distributed before each child receives a distribution.
- If there is no data for the Weighting Plan Item, the change in plan value will be equally distributed to all children.
Example D: Weighted Distribution method with optimization
Imagine a plan item for Sales is projected to increase from 1000 to 1500 from June to July. The projected plan values are broken down as follows:
| June | July | |
|---|---|---|
| Sales | 1000 | 1500 |
| A | 300 | 450 |
| B | 200 | 500 |
| C | 500 | 550 |
Let's say the projected value for July is too high so you decrease the Sales plan value from 1500 to 800.
| June | July | |
|---|---|---|
| Sales | 1000 | 800 |
| A | 300 | |
| B | 200 | |
| C | 500 |
The change in plan value of -700 (800 - 1500) will be distributed to Team A, B, and C. Since the plan value was projected to increase from the previous period, this value is first distributed to the children that received gains. The optimization is calculated as follows:
| Team | Initial Plan Value (July) | Previous Period Plan Value (June) | Gain from Previous Period | Distribution Value to Offset Gain |
|---|---|---|---|---|
| A | 450 | 300 | +150 (450 - 300) | -150 |
| B | 500 | 200 | +300 (500 - 200) | -300 |
| C | 550 | 500 | +50 (550 - 500) | -50 |
| Total | 1500 | 1000 | +500 | -500 |
Note: The value is distributed in order based on the amount gained from the previous period. In this example, we first calculate and distribute the value to Team B because it had the highest gain (+300). We would then distribute the value to Team A and then finally to Team C.
After this optimization, the change in plan value that is left to be distributed is -200. We distributed 500 to the children to offset their gains from the previous period.
The remaining value of -200 is distributed to the children using the Weighted Distributed method. Using the details from Example C, if the distribution method for the plan item is weighted by Headcount, the value will be distributed as follows:
| Team | Optimized Plan Value | Distribution Value | Final Plan Value |
|---|---|---|---|
| A | 300 | -20 (-200 * 10%) | 280 |
| B | 200 | -40 (-200 * 20%) | 160 |
| C | 500 | -140 (-200 * 70%) | 360 |
Auto-fix distribution
When you change the plan value at the parent level, the value is automatically distributed to its children. Conflicts can arise in the planning grid when you enter a plan value and the distributed values at lower levels of the plan fall outside of the acceptable minimum or maximum values set by the plan modeler.
Let's say the plan modeler has set a maximum value of 100% for the Goal Representation Ratio plan item and you change the plan value at the All level to 94%.
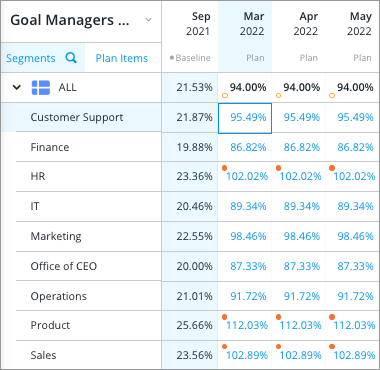
In this example, when the plan value of 94% is distributed, conflicts appear at the lower levels of the plan because the values exceed the maximum value of 100% (HR, Product, and Sales).
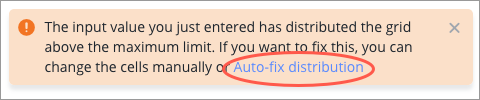
You can solve these distribution conflicts manually or automatically recalculate the distribution to fit the minimum or maximum values.
To solve all distribution conflicts in the planning grid:
- Click Auto-fix distribution on the warning message at the bottom of the planning grid.
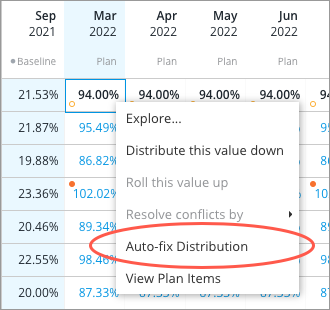
To solve distribution conflicts for a single column:
- Right-click a cell in the column and click Auto-fix distribution in the In-context menu.
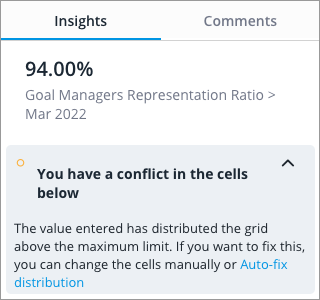
- Select the edited cell that caused the distribution conflict, expand the You have a conflict in the cells below note in the Insights tab of the Info panel, and click Auto-fix distribution.