
Plan Items
Learn more about plan items in plan models.
Overview
Plan items are the building blocks of the plan model, they can be created to calculate other fields in the model or pull in new data. They represent the specific elements you want to track and measure and can appear as the line items in your plan.
Plan items are driven by the data and logic you define within the plan item formula. Plan items can also be set as goals to provide boundaries for planners to stay within. If you want to analyze a plan item in Explore, you will need to create and attach an associated plan metric.
There are two types of plan items in plan models:
- Assumptions: These are cells in the planning grid where planners directly input assumed or potential values. For example, you might have an Added Positions assumption where a planner can enter their assumed number of added positions for each department for the upcoming year.
- Projections: These are cells in the planning grid whose values are derived from other plan items and inputs. These calculations are based on a combination of inputs, assumptions (user-entered values in other plan items), and other projections (values from other calculated plan items). Planners cannot directly edit the values in projection cells. For example, a projection for Expected Exits might be calculated by the model using an Expected Retirements plan item (an assumption), a Seasonality of Employee Exits input, and a Known Exits plan item (another projection or assumption).
Assumptions
Assumptions are plan items that allow planners to directly input their anticipated or potential values into specific cells within the plan. Assumptions start with a predicted value, and planners can adjust the specific areas where they want to change that value. Assumptions provide a direct way for planners to incorporate their expectations around certain values and model different scenarios.
The values entered into assumption plan items often serve as the starting point for calculating other, more complex plan items (projections). Plan item formulas within the model can reference these assumed values to drive automated calculations.
Example:
Let's say you are building a workforce plan and need to project the number of exits for the upcoming year. You might create an assumption plan item called Expected Retirements.
In the plan, the planner would see the predicted retirements for each group, generated from the assumption's formula, and in segments where they expect a different behavior they could set a new number for the assumption.
For example, if a planner wants to model a scenario where they provide a retirement incentive, they could manually increase the retirement counts at the time when they would offer the incentive.
This Expected Retirements assumption might then be used to calculate a projection plan item called Total Exits. The formula for this projection might be:
Total_Other_Exits + Expected_Retirements + Total_Resignations + Additional_ExitsBy changing the Expected Retirements assumption for a department (e.g., increasing it from 2 to 4 in Sales), the Total Exits projection would automatically update, allowing planners to understand the potential impact of increased retirements on their workforce.
In this example, the Expected Retirements assumption provides a direct way for planners to incorporate their expectations about employee retirement, which then drives the calculation of projected exits within the workforce plan.
Projections
Projections are plan items whose values are derived from other plan items and inputs; calculated based on their formula. Projection formulas incorporate inputs and other plan items to perform complex calculations.
By referencing other plan items in projection formulas, you can create intricate chains of calculations, allowing the model to build up complex forecasts. Projections automatically update whenever the underlying plan item and input values change. This allows for real-time scenario analysis and a clear understanding of how different factors influence the projected outcomes.
Example:
Let's say you create a projection plan item called Projected Replacement Costs.
To calculate this, you might configure the following components in your plan model:
- A metric input for Average Cost Per Hire.
- An assumption plan item called Annual Resignation Rate, which is used to calculate another projection plan item called Projected Voluntary Turnover.
The formula for the Projected Replacement Costs projection plan item could be:
Projected Voluntary Turnover * Average Cost Per HireIn this scenario, the Projected Replacement Costs value is entirely dependent on the calculated Projected Voluntary Turnover (which itself relies on the assumed resignation rate) and the Average Cost Per Hire metric.
If a planner changes the Annual Resignation Rate assumption, both the Projected Voluntary Turnover and, subsequently, the Projected Replacement Costs will automatically recalculate, showing the impact of the changed assumption on hiring expenses. Similarly, if the Average Cost Per Hire metric updates upon updating the plan baseline, the Projected Replacement Costs will also reflect this change.
In this example, we can see how you can create intricate chains of calculations, allowing the model to build up complex forecasts. Projection plan items automate calculations and provide dynamic insights based on the relationships between your application data and the assumptions defined by planners. They allow you to define the underlying factors that influence your planned outcomes.
Plan item formulas
Plan item formulas define how the values for plan items are calculated within the planning grid. You define the calculation logic by referencing various inputs and other plan items within your model. This allows you to project values based on underlying data and established relationships.
Within a formula, you can reference plan inputs and other plan items to define how the target plan item's value should be calculated. Formulas allow you to express complex relationships and calculations using standard mathematical operators (addition, subtraction, multiplication, division), functions (like averages or lookups), and references to other elements in your plan model.
Use the Formula dictionary found by expanding the Formula tab to find functions and objects to use in your plan item formula. For more information, see Visier Modeling Language (VML).
Note: It's crucial to understand that plan item formulas are directly applied only to the lowest leaf level in your plan's structure (often referred to as the "leaf segment"). Values for higher-level aggregations (often referred to as the "parent" level) are derived through roll up (summing the values of their children), or through direct manual cell entry at those higher levels.
Example:
Let's say you want to create a projection plan item called Projected Voluntary Turnover. You've configured the following components in your plan model:
- An assumption plan item called Annual Resignation Rate (e.g., planners input values such as 15%).
- An input called Headcount Input for each department.
The plan item formula for Projected Voluntary Turnover could be:
prevWithSeed(Headcount_Input) * Annual_Resignation_RateIn this formula:
- prevWithSeed is the function pulling the value of the Headcount plan item in the previous period (or, if it is the first period of the plan, it takes the value of the Headcount input).
- Headcount_Input references the data brought in by our plan input.
- Annual_Resignation_Rate references the value entered by the planner in our assumption plan item.
- The asterisk (*) represents the multiplication operation.
Let's say your plan is segmented by the Organization Hierarchy. When this formula is applied, the model will take the headcount for each department and multiply it by the assumed annual resignation rate for that department to calculate the projected number of voluntary exits for that department. If the Annual Resignation Rate assumption is changed, the Projected Voluntary Turnover will automatically recalculate based on the new assumption.
As mentioned earlier, this formula is applied at the leaf segment (i.e., individual departments). Higher-level parent values for Projected Voluntary Turnover are calculated by rolling up the departmental values.
Aggregation
Plan item aggregation determines how to handle parent-child relationships in plans, such as how child values are added up to recalculate parent values.
Roll up methods
When you edit the value of a plan item at the child level, the child values are rolled up to calculate a parent value. Parent values are calculated using one of the following methods:
- Sum of Children: The child values are added up to calculate the parent value. This roll up method is used for plan items that are counts such as Headcount and Added Positions.
- Weighted Average: The child values are multiplied by their contribution to the plan item that is configured as the Weighting Plan Item. These values are then added up to calculate the parent value. This roll up method is used for plan items that are rates such as Annual Resignation Rate.
For more information on roll up methods, see How Plan Values Are Rolled Up.
Consolidation methods
When you create subplans, the submitted plan values get combined back into the main plan using a consolidation method on your assumptions. Subplan values are consolidated using one of the following methods:
- Use rollup method: By default, the rollup method on the plan item is used for consolidation.
- Rate-based consolidation: Allows the assumption to change on consolidation to keep a projected value stable.
In plans where consistency between the main plan and subplan is crucial—such as for projections like Resignations or New Starts, you may want to choose rate-based consolidation. Rate-based consolidation adjusts the rate assumption to ensure values between the main plan and the subplan match. This method takes the final value from the subplan and back-calculates the necessary rate to make that number true in the main plan.
When a subplan is consolidated using the rollup method, totals in the main plan may differ from the subplan due to rounding and randomization. This can happen when a subplanner plans at a more detailed level and uses a different segmentation than the main plan.
For example, let's say the main plan is segmented by Country and State and the subplanner adds Gender to their subplan segmentation and adjusts the values for Annual Resignation Rate.
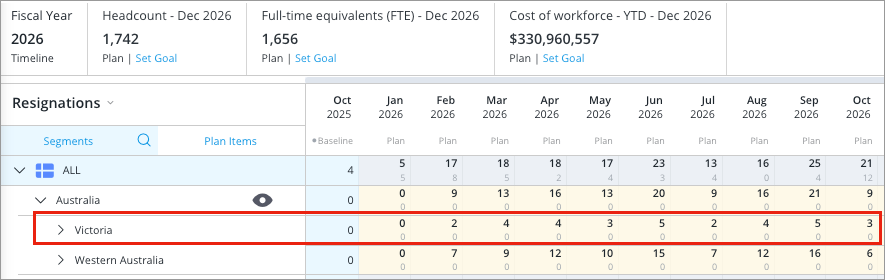
In the subplan, we see the following Resignation totals for Victoria:
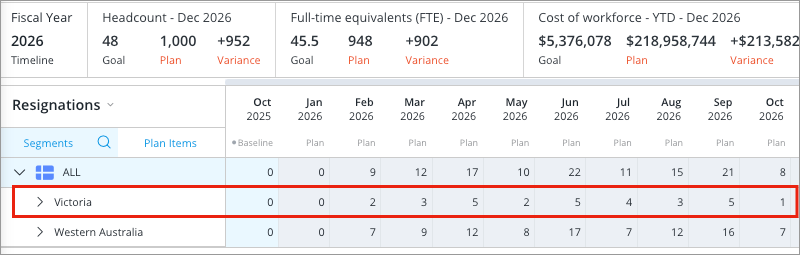
When the subplan is rolled up, we can see that the Resignation totals for Victoria in the main plain differ slightly. For example, the value in the subplan for March 2026 is 3, whereas in the main plan it's 4. This is due to the addition of the Gender dimension in the subplan segmentation, causing values to differ slightly in the main plan due to rounding and randomization during rollup.
Example: Apply rate-based consolidation on the Annual Resignation Rate assumption
The Headcount and Cost Planning (New) model uses a "carryover" method to ensure you don't miss resignations in the long run.
To calculate exactly how many people leave each month, the model looks at:
- Precise Resignations:
Annual_Resignation_Rate * Seasonality_Of_Resignations_By_Period * Headcount + prev(Carryover_Resignations, random(position())) - Carryover Resignations:
Precise_Resignations - floor(Precise_Resignations) - Resignations:
floor(Precise_Resignations)
In these formulas, Headcount, Annual Resignation Rate and Seasonality of Resignations are assumptions. The calculation Annual_Resignation_Rate * Seasonality_Of_Resignations_By_Period determines the resignation rate of the month. This gets multiplied Headcount to get the Precise Resignations. From the Precise Resignations, we take the floor to get an integer as the number of resignations in a month. To not miss resignations in the long run, we have a carryover. The carryover is initialized with a random number to avoid having all exits happening at the same time (this can happen when several leaf segments have the same number of employees and the same rates).
If a subplanner plans at a more detailed level and uses a different segmentation than the main plan, the carryover can lead to values being different between the main plan and the subplan, causing different projections. To avoid this, we can set up Rate-based Consolidation on the Annual Resignation Rate assumption as follows:
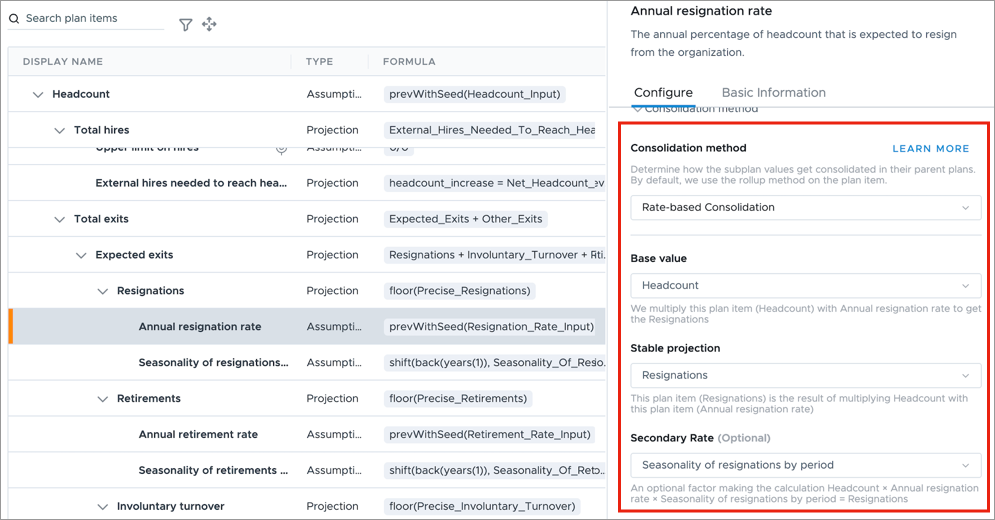
This method allows the Annual Resignation Rate to adjust automatically during consolidation to keep Resignations consistent between the main plan and the subplan. The calculation works backward to determine the value for Annual Resignation Rate using this simplified logic:
Resignations = Headcount * Annual Resignation Rate * Seasonality Of Resignations By Period
For rate-based consolidation to work, the following criteria must be met:
- The base value (e.g., Resignations) must be identical in both the main plan and subplan.
- Secondary rates (such as Seasonality) cannot be zero or NaN.
- Each plan item can only be set as a stable projection for one specific assumption. You cannot link two different plan items, each relationship must be unique to avoid calculation conflicts.
Plan goals
Plan items can also be set as goals to provide boundaries for planners to stay within. By setting upper or lower limits, goals help you gauge the success of your plan by comparing projections or assumptions against them and ensuring planners stay within budgeted values. Cells will have a dot if it is outside the bounds of the goal.
If you designate a goal as a key goal, they will be displayed on the top goals bar within the plan interface, providing immediate visibility into performance indicators. Key goals are evaluated at the end of each plan's fiscal period and cells will appear red if that segment is outside the bounds of the goal.
These goals can be established for subplanners at the start of collaboration. Goals are also line items in your plan that you can set before collaboration starts.
By leveraging plan items as goals with defined upper and lower limits, you can effectively monitor progress, identify potential risks or successes, and drive your planning process towards desired outcomes.
Upper limits
When a plan item is set as an upper limit goal, the aim is for the corresponding plan values to remain below this goal. Exceeding the upper limit is generally considered unfavorable, indicating a potential issue or exceeding allocated resources. Conversely, falling below the upper limit is typically seen as positive, signifying that you are within the defined constraints.
Example: If Budgeted Headcount is set as an upper limit goal for Projected Headcount, the objective is for the actual projected headcount in each segment to be less than or equal to the budgeted amount. Going above the budgeted headcount might signal overspending or a deviation from the planned organizational structure. Staying below indicates efficient resource allocation.
Lower limits
When a plan item is set as a lower limit goal, the aim is for the corresponding plan values to be above this goal. Dropping below the lower limit is generally considered unfavorable, indicating a potential shortfall or underperformance. Surpassing the lower limit is generally positive, signifying that you are meeting or exceeding the desired threshold.
Example: If Goal Representation Ratio is set as a lower limit goal for Projected Representation Ratio, the objective is for the actual projected representation ratio to be greater than or equal to the established goal. Falling below this target might indicate a lack of progress towards diversity and inclusion objectives, while exceeding it demonstrates positive movement in the desired direction.
Plan metrics
If you create a new plan item and want to analyze it in Explore to create analyses and charts, you will need to create an associated plan metric. Think of a plan metric as the analytical representation of your plan item's data, making it accessible for analysis. Plan metrics are not automatically created when you create a new plan item, you will need to create and attach a corresponding plan metric for each plan item that you intend to use for analysis or to display in charts. If you created a new plan model, you will need to create a plan analytic object for it as well. If you duplicate an existing plan model, the metrics and plan analytic object associated with that plan model will be copied automatically. For more information, see Create a Plan Metric.
Plan metric formulas
There are two types of functions for plan metric formulas: roll up (i.e., aggregate sum) and lookup. The type used is dependent on the roll up method used for the corresponding plan item. The following table highlights what function to use based on what roll up type is used in the plan item.
|
Plan item roll up method |
Plan metric function |
|---|---|
|
Sum |
lookup |
|
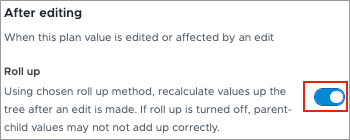
Sum + Roll up is toggled on under "After editing"
|
aggregate sum |
|
Weighted |
lookup |
Depending on the plan item roll up method, the formula for the plan metric will follow one of the following structures:
- on (Plan_Analytic_Object) aggregate sum(plan_item)
- on (Plan_Analytic_Object) lookup(plan_item)
Example:
Let's say you created a new plan item in the Headcount and Cost Planning (New) model for Base Pay. The roll up method for the Base Pay plan item is sum, and roll up is toggled on. Now, you want to create an associated plan metric for the Base Pay plan item to allow planners to analyze the data in Explore.
When writing the plan metric formula, you would:
- Include the plan analytic object for the plan model. For example, Headcount and Cost Planning.
- Include a function. For example, aggregate sum.
- Include the object name of the plan item, this is found in the Basic Information tab of the plan item. For example, Base_Pay.
The plan metric formula would be written as follows:
on Headcount_And_Cost_Planning aggregate sum(Base_Pay)