
Visier Benchmarks Trend vs Report
Learn about the differences between Visier Benchmarks Trend and Visier Benchmarks Report.
There are three key differences between Visier Benchmarks Trend and Visier Benchmarks Report:
- Data sparsity: Both sets of benchmarks are generated by aggregating Visier customer data. In order to keep customer information confidential, certain data is not included in the benchmarks. Visier Benchmarks Report was introduced to address the sparsity in the Visier Benchmarks Trend data as we are able to interpolate some of the missing values using the available data. There is data sparsity in both Trend and Report. With Trend, you get an accurate, but sparse dataset while Report gives you a more complete dataset with a certain degree of approximation.
- How historical benchmarks are handled: As Visier's customer base grows, the dataset for the generation of benchmarks grows, resulting in better and more accurate benchmark values. Visier Benchmarks Trend values are periodically updated while Visier Benchmarks Report are never updated after they have been published. Visier Benchmarks Trend updates historical benchmark values to provide the most accurate benchmark values at all times. Visier Benchmarks Report keeps the historical benchmarks unchanged and ignores the growth of our customer base.
- Release schedule and available time periods: Visier Benchmarks Trend contains quarterly benchmark values while Visier Benchmarks Report is released annually and only contains annual benchmark values.
Visier Benchmarks Trend
Visier Benchmarks Trend should be used for trend analysis and allows you to compare your organization's performance against an accurate measure of change in the market. These benchmarks are directly sourced by aggregating data from Visier customers. New benchmark values are generated quarterly and the historical benchmarks are updated periodically in a new time series.
Which time periods are benchmarks available?
Visier Benchmarks Trend are calculated for each quarter. To allow our customers to make data corrections and to ensure the benchmark values are accurate, we delay the release of Visier Benchmarks Trend by one quarter.
For the most recent time periods where measured benchmark values are not yet available, one of two values will be shown:
- For ratios, the benchmark value from the last quarter where a benchmark value existed.
- For rates, a benchmark value extrapolated from the available time series data.
We have two types of metrics: rates and ratios, which are treated differently depending on whether seasonality is an important factor. Ratios (for example, women ratio), generally do not change with the season, so Visier will show the benchmark value from the last quarter where a benchmark value existed. Rates (for example, resignation and promotion rate) can display distinct seasonal trends. For example, your organization may experience more resignations than average in the same quarter every year. We include this seasonality by extrapolating benchmark values from the available time series data using a modified seasonal ARIMA method that can be applied even if some quarters have no published benchmark values. To extrapolate, we must have the most recent published benchmark value and published benchmark values from at least two previous quarters. These extrapolated values will be replaced once benchmark data for the quarter becomes available.
What benchmark values are published for each release?
The Visier Benchmarks Trend dataset consists of measured and extrapolated values, as shown in the following illustration.

Visier provides measured benchmarks for time periods that have high quality data and then extrapolated benchmarks for the four quarters following the last measured period. Extrapolated benchmarks are estimated from the measured benchmarks. With each subsequent release, we publish measured benchmark values that replace the extrapolated values for these time periods. To allow sufficient time for data correction and validation, there is a three-month (quarter) deferral period from when data is collected to when it is posted. This ensures that data corrections that are commonly made by our customers are included in the benchmarks.
For example, let's say the current Visier Benchmarks Trend dataset contains measured benchmarks up to Q1 2018 and extrapolated benchmarks from Q1 2018 to Q4 2018. In the next quarterly release, which coincides with the start of Q3 2018, the following occurs:
- The extrapolated values for Q1 2018 will be replaced with measured values.
- The extrapolated values for Q2 2018, Q3 2018, and Q4 2018 are replaced with updated values based on the last measured quarter.
- Extrapolated values for Q1 2019 are added.
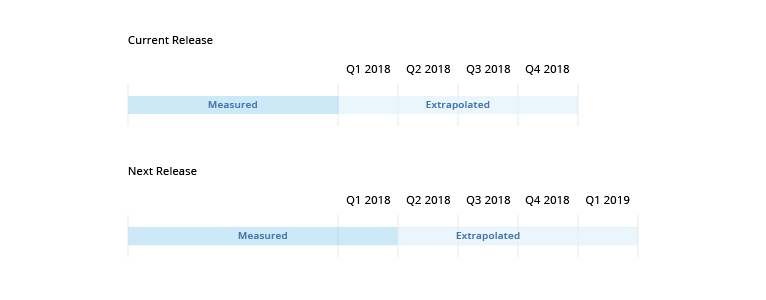
As illustrated in the previous example, there is a three-month deferral period as measured values for Q1 2018 are not released until Q3 2018.
Extrapolations are always based on the latest period of measured benchmarks, so you should expect the extrapolated values to change over time as accurately measured benchmark data becomes available. What this means is that the benchmark slices that were available in previous releases may no longer be available in newer releases because the measured benchmarks no longer support this slice. Furthermore, new benchmark slices may become available in the extrapolated time periods because these slices are now supported by the measured benchmarks.
The current breakdown of Visier Benchmarks Trend:
- Measured values from Q1 2022 to Q4 2025.
- Extrapolated values from Q1 2026 to Q4 2026.
Note: Exceptions
- 90 Day Resignation Rate of New Starts
- Measured values conclude with the most recent complete 90-day period.
- No extrapolated values are provided.
- 1 Year Resignation Rate of New Starts
- Measured values conclude with the most recent complete 1-year period.
- No extrapolated values are provided.
Why is benchmark data sparse?
When you slice a Trend benchmark and there is no value available for the dimension members you selected, the solution displays an N/A value. This means there are holes in the data and we have a sparse benchmark data set. Holes in the data are quite common and expected because they are a direct consequence of providing benchmarks for every cross-section of the large number of dimensions that Visier Benchmarks supports. The ability to slice-and-dice the benchmarks in the same way as your own data using our solution is what makes Visier Benchmarks so valuable. It allows for apples-to-apples comparisons that are meaningful and directly fit your business question.
It is important to note that the sparsity in the benchmarks is not determined by the size of the population you are analyzing. For example, If a benchmark for the US is not available, a benchmark for US-Northeast may exist.
Visier has published over 250,000 benchmark values that cover the following dimensions: industry, location, manager, gender, performance, job function, ethnicity, age, and tenure. However, not all combinations of dimension members are available. The cause for this sparsity of the multi-dimensional Visier Benchmarks Trend the promise to protect customer data. It does not mean that we don't have data for this population, but that we excluded the benchmark value from publication to secure confidentiality of customer data related to this or another population slice.
If there is no value available for the dimension members you selected, you can try exploring Visier Benchmarks Report. Report is less sparse because we are able to interpolate missing values based on the available Trend data.
How to use sparse benchmarks
The guidebook is a good starting point to understand which benchmarks are available. It has topics that cover a selection of benchmarks by various group by dimensions. However, the best way to use the benchmarks is to try to add it as a comparison to your existing or ad hoc analyses. To do this, define the analysis based on your own organization and then add the benchmark for comparison. The key is to not get discouraged when you see that some higher level benchmarks are not available.
As previously mentioned, even if a benchmark for a larger population does not exist, benchmarks for a subset of that population may be available. This means that if there is no ethnicity available for a resignation rate benchmark for US employees, there may be an ethnicity available for US-Northeast. It is important to understand that even though you don’t apply a filter for a dimension, you are still selecting a very filtered view of the benchmarks. Not setting any dimension filter actually means that you are looking at: Location: All, Manager: All, Gender: All. This is just a particular slice of benchmarks that you are looking at. You may see ethnicity benchmarks when you add a filter (for example, Is Manager).
The common mental model when doing multi-dimensional data analysis is a tree. The trunk is the overall population without dimension filters, and every branch adds filters. Therefore you expect that most information is available for the trunk and that the information becomes increasingly spotty as you move closer to the leaves. However, this mental model is not valid when you look at Visier Benchmarks. The data should actually be pictured as a cube, (actually a hypercube, a cube with more than 3 dimensions). The sparsity is spread more or less evenly throughout the cube, so every combination of dimension selection can be affected.
Information about available benchmark values
For every Visier Benchmarks Trend metric, Visier provides a spreadsheet that contains a complete list of the published benchmark values that can be used for comparison.
You can download the spreadsheet in the metric explanation for each Visier Benchmarks Trend metric. To download the spreadsheet, hover over the Visier Benchmarks Trend metric in the visual title, hover over the Help icon, and then click More info. In the explanation, click the Download quality information for this benchmark link.
How to use the Quality Information spreadsheet to find available benchmark values
Each row in the spreadsheet corresponds to one published benchmark. It tells you the time period and specific combination of dimension members you can filter your analysis context by to see the benchmark value.
By reviewing and applying filters to this spreadsheet, you can quickly determine:
- Whether a specific benchmark value exists.
- What benchmark values are available for a specific time period.
- How precise your comparison can get. What additional filters can be applied to refine my analysis population.
The spreadsheet is organized into the following sections:
- Time: The time period of the published benchmark.
- Dimensions: The dimensions you can filter the benchmark on. Blank dimension cells mean there is no filter applied or all possible values.
- My Benchmarks: The My Visier Benchmark metrics are automatically filtered based on your organization's Company Size and Industry. To determine what benchmark values are available for My Visier Benchmark metrics, you'll need to filter the spreadsheet by Company Size and Industry to reflect your view. These dimensions are also primary dimensions.
- Primary Dimensions: You can select any number of these dimensions when filtering the benchmark.
- Secondary Dimensions: You can select only one of these dimensions when filtering the benchmark.
- Group By Dimension: To view data for Percent of Headcount benchmarks, you must select the specified dimension when grouping or filtering the benchmark. For example, when looking at Headcount by Ethnicity - My Visier Benchmark - Trend, you must group or filter the benchmark by the Ethnicity dimension to see values.
- Quality Information: Indicators that can be used to assess the quality of the benchmark.
Note: Combining primary and secondary dimensions to filter the benchmarks
You can apply filters to view benchmarks for a specific analysis population. The dimensions you can filter on are divided into Primary and Secondary Dimensions. You can filter on any number of the Primary Dimensions and one Secondary Dimension.
For example, you can see benchmark values for:
- Women in California who are managers (3 Primary Dimensions: People Manager, Gender, Location).
- Women in California who are managers and between the ages of 20 and 25 (3 Primary Dimensions: People Manager, Gender, Location + 1 Secondary Dimension: Age).
- Employees who are between the ages of 20 and 25 (1 Secondary Dimension: Age).
You cannot see a benchmark value for:
- Women in California who are managers, between the ages of 20 and 25, and have 1 to 2 years of tenure (2 Secondary Dimensions: Age, Tenure).
Example: Let's say, you work for an enterprise company in High Tech and you want to know if there are any published benchmarks for Managers in California for Minority Ratio - My Visier Benchmark - Trend.
To find this information, you can download the spreadsheet for Minority Ratio - My Visier Benchmark - Trend and apply the following filters:
- People Manager: Managers
- Location: US | West | California
Since you're looking at the My Visier Benchmark, you'll also have to apply filters to see what benchmark values are available for your company size and industry:
- Company Size: 1000+
- Industry: High Tech
After you apply the filters, you get the following results:
| My Benchmarks | Primary Dimensions | Secondary Dimensions | |||||||
|---|---|---|---|---|---|---|---|---|---|
| Time | Company Size | Industry | Location | People Manager | Gender | Age | Job Function | Performance Group | Tenure |
| 2018-Q1 | 1000+ | High Tech | US | West | California | Managers | |||||
| 2018-Q3 | 1000+ | High Tech | US | West | California | Managers | Female | ||||
| 2019-Q1 | 1000+ | High Tech | US | West | California | Managers | Male | 2-3 yrs | |||
| 2019-Q2 | 1000+ | High Tech | US | West | California | Managers | Female | 2-3 yrs | |||
| 2019-Q2 | 1000+ | High Tech | US | West | California | Managers | 2-3 yrs | ||||
Based on the results, you can see that the only time period where you'll see a benchmark value for Managers in California is Q1 of 2018. However, there are also some time periods where you can apply additional filters for more precise comparisons. For example, in Q3 of 2018, you won't see a benchmark value for Managers in California, but there is a published value for Women who are Managers in California.
Note: If you want to narrow the results to see whether a benchmark value exists for a specific combination of dimensions, you will need to filter out the rows where there are values for the dimension columns that you're not interested in. In this example, you would filter the following columns to only show Blanks:
- Age
- Job Function (EEOC)
- Performance Group
- Tenure
After you apply these filters to this example, the results will only show the 2018-Q1 row.
How do we measure the accuracy of benchmark data?
We use confidence intervals to measure the accuracy of each benchmark. The employee population that Visier has access to is a finite sample of all employees that fit the benchmark description (for example, managers who are women in California). Since the sample only contains a portion of the employee population it can never be a perfect representation of the entire population. A confidence interval is a statistical measure that expresses how accurate a metric that is calculated on the finite sample is likely to be. We measure the confidence interval for each benchmark and we want the interval to be as narrow as possible. If the interval is too wide, we do not publish the benchmark value.
One source of uncertainty for Visier Benchmarks is that the number of contributing companies is limited. Generally, the larger the sample size, the more likely it is that the benchmark value accurately describes the overall population. Companies have different cultures leading them to make decisions differently, and a relatively small sample of companies can make the benchmark less accurate. To account for this, we recalculate the confidence interval repeatedly, each time based on an employee population that is taken from a subset of the available companies. The resulting confidence interval estimates the uncertainty of the benchmark due to variation across companies. Once again if the confidence interval is too wide, we do not publish the benchmark value.
We also provide detailed information for each published value for Visier Benchmarks Trend, so you can access their quality for yourself.
What quality control measures are implemented?
Visier is strongly committed to providing high quality benchmarks. Before a benchmark value is published, it must meet the following quality control measures:
- The benchmark value is calculated from a sample of at least 500 employees.
- The benchmark value is calculated from employees of at least 5 organizations. The total employee population cannot be comprised mostly of employees from one organization.
- The confidence interval, using the full sample, around the benchmark value is small.
- The confidence interval, using a statistically varied sample of companies, around the benchmark value is small.
Beyond applying strict quality controls, we also provide our customers with detailed information for each published benchmark value so they can assess the quality for themselves.
How to interpret the quality control information
We provide CSV files in the solution that contain quality information for each published benchmark value. You can find the CSV files in the explanations for each benchmark metric.
The quality information provided by Visier addresses:
- The sample size of each benchmark value (based on the set of employees used to generate the benchmark).
- The quality of the trend over time (based on the changing dataset over time).
The Confidence interval boundary column shows the difference between the benchmark and the confidence interval boundary, measured at a 75% confidence level.
- For rates (currently Resignation and Promotion rate) the difference is measured relative to the benchmark value.
- For ratios the absolute difference is provided.
The Trend quality column indicates the existence of possible trend artifacts due to changes in the employee data set. The trend quality can be assigned one of the following ratings:
- Green. The benchmark trend has no artifacts.
- Yellow. The significant change in the employee dataset has a limited impact on the benchmark trend.
- Red. The benchmark trend contains an artifact. The significant change in the employee dataset has introduced misleading information in the trend.
How trend quality is measured
The trend quality identifies whether significant changes in the data set has led to the creation of an artifact. The presence of an artifact means that misleading information has been introduced to the trend of a benchmark over time.
The trend quality is measured in two steps:
- The relative change of the overall employee count in the data set is measured for consecutive times in the trend. If the change is below 25%, a trend chart quality of Green is assigned.
- If a strong data set change is found, we compare the measured benchmark value with an estimated value for the same point in time that is based on the other data in the benchmark trend. Strong differences between the measured benchmark value and the estimated value indicates the presence of artifacts and a trend quality of Yellow or Red is assigned.
Nonseasonal metrics
For non-seasonal benchmarks, the estimate is the benchmark measured at the closest previous time in the trend. Using both values we can calculate the relative difference of measured and estimated benchmark for each point in the trend.
A Yellow trend quality is assigned when at the time of the data set change:
- The standardized relative difference is 2.5 to 3 times the standard deviation, and
- The relative difference is 15% to 25%.
A Red trend quality is assigned when at the time of the data set change:
- The standardized relative difference is larger than 3 times the standard deviation, and
- The relative difference is above 25%.
Seasonal metrics
For seasonal benchmarks, we calculate an estimate value based on the measured benchmark at the closest previous time and measured seasonal differences. This technique is essentially a modified seasonal ARIMA.
The relative difference of measured and estimated benchmark value is calculated for every point in the trend.
A Yellow trend quality is assigned when at the time of the data set change:
- The standardized relative difference is 1.5 to 2 times the standard deviation, and
- The standard deviation of the relative difference is 20% to 40%.
A Red trend quality is assigned when at the time of the data set change:
- The standardized relative difference is larger than 2 times the standard deviation, and
- The standard deviation of the relative difference is above 40%.
Why is a new time series released each year?
Visier is strongly committed to providing high quality and timely benchmarks. This is why when we generate new benchmarks, we use all available data from the organizations in Visier's Benchmarking program. This means the data set that we use can be different from one quarter to the next as organizations join or leave the Benchmarking program. As a result of using a dynamic data set, observable trends may be introduced to a benchmark value over time. To limit this effect, we will periodically publish a new time series for Visier Benchmarks Trend that uses a consistent set of organizations and employees and contains updated historical values.
Note:
- The historical values of previous time series benchmarks will not be changed.
- You will be notified when we publish a new time series for Visier Benchmarks Trend.
- To protect the data confidentially of our customers and to ensure historical benchmarks are useable, we cannot update historical benchmarks every time that new benchmarks are released. You will have one release to change over to the new benchmark series.
Visier Benchmarks Report
Visier Benchmarks Report are easy to use, annual benchmark values that allow you to make reliable point in time comparisons. Historical benchmark report values are never updated and new benchmarks are generated annually from the Visier Benchmarks Trends dataset. We use interpolation to fill in missing values in the data to simplify their usage. Sparsity exists in the Reports dataset because we have insufficient Trends data to create reliable interpolations.
Use Visier Benchmarks Report to compare your organization's HR metrics at a fixed point in time with a snapshot of HR benchmarks generated across organizations in your industry or across all industries.
Even as our customer base changes, historical Visier Benchmarks Report values are never updated. Therefore, these benchmarks are a reliable way to recall the state of your organization at a historical point in time along with historical benchmark values at that time. Since Visier Benchmarks Report are not updated to reflect Visier's most recent customer base, these benchmarks are not suited for time comparison studies.
Which time periods are benchmarks available?
Visier Benchmarks Report are calculated for each year. For time periods where measured benchmark values are not yet available, the benchmark values from the last measured year are shown as extrapolations. This allows an easy-to-use comparison of benchmarks with your organization in the current time period. Once the Visier Benchmarks Report values for the next year are measured and published, they replace the extrapolated values.
What benchmark values are published for each release?
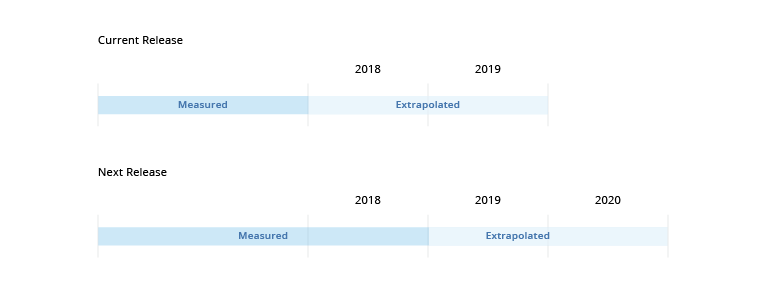
The Visier Benchmarks Report dataset consists of measured and extrapolated values, as shown in the following illustration.

Visier provides measured benchmarks for time periods that have high quality data and then extrapolated benchmarks for the two years following the last measured period. Extrapolated benchmarks are estimated from the measured benchmarks. New benchmark values are calculated and published once all four quarters in a given year have been measured. The benchmark values of measured benchmarks will not change over time.
For example, let's say the current Visier Benchmarks Report dataset contains measured benchmarks up to 2018 and extrapolated benchmarks for 2018 and 2019. In the next annual release, which coincides with the start of 2019, the following occurs:
- The extrapolated values for 2018 will be replaced with measured values.
- The extrapolated values for 2019 are replaced with updated values based on the last measured year.
- Extrapolated values for 2020 are added.
Extrapolations are always based on the latest period of measured benchmarks, so you should expect the extrapolated values to change over time as accurately measured benchmark data becomes available. What this means is that the benchmark slices that were available in previous releases may no longer be available in newer releases because the measured benchmarks no longer support this slice. Furthermore, new benchmark slices may become available in the extrapolated time periods because these slices are now supported by the measured benchmarks.
The current breakdown of Visier Benchmarks Report:
- Measured values for 2017 to 2025.
- Extrapolated values for 2026 and 2027.
How are missing values interpolated?
Benchmark values for certain populations (that is, combinations of dimension members like: Managers who are women in California) are not published for Visier Benchmarks Trend to protect customer confidentiality.
In Visier Benchmarks Report, some of these missing benchmark values are interpolated using the k-nearest neighbors (k-NN) technique. k-NN is a popular technique used to infer missing data based on the available data with similar characteristics, or, in our case, with similar populations. Since only published benchmark values are used for the interpolation, the added benchmark values cannot be used to uncover confidential information.
The k-nearest neighbors are identified by measuring the similarity, or distance, between the missing benchmark slice (that is, the population defined by a unique combination of dimension members) and all slices of published benchmark values. Visier calculates the distance of two slices by measuring the cumulative distance between dimension members of both slices (only pairing members of the same dimension). This distance of two dimension members is estimated based on the average differences in metric value and headcount of all pairs of published benchmark values that contain these two dimension members.

Here, D({vmissing}, {vavailable}) denotes the cumulative distance between the missing benchmark slice, defined by a set of dimension values {vmissing} and the available benchmark slice, defined by a set of dimension values {vavailable}. The summation carries over all dimensions members by pairing members of the same dimension and calculating headcount-based distance between the i-th pair, Dheadcount(vimissing, viavailable), and the metric-based distance between the same i-th pair, Dmetric(vimissing, viavailable), correspondingly.
Once the k-nearest neighbors are identified, the missing benchmark value is estimated by weighted average of the benchmark values of the nearest neighbors as follows:

Here, k indicates k-th nearest neighbor, and wk are the weights assigned to the k-th nearest neighbor according to their distance from the missing metric value, wk = 1/D({vmissing}, {vavailable}k)
Visier Benchmarks for any given year will reflect Visier's customer base for that year. To provide the most reliable benchmark measures, starting 2018, the annual Visier Benchmarks Report values will be calculated based on data from both the previous and current year. The annual values are estimated using weighted averages over all eight quarters of the previous and current years’ Visier Benchmarks Report data.