Top Prediction Attributes
Identify the employee attributes that most strongly influence a prediction score and how they're calculated.
Overview
Top prediction attributes show you the specific factors, like tenure or base pay, that had the strongest impact on that score. Each attribute comes with an associated prediction score, calculated by averaging historical event likelihoods across the decision trees where that attribute was used. Comparing the attribute score to the prediction shows whether the attribute increased or decreased the prediction score.
Use top prediction attributes as a starting point for action. They help you understand what's driving an individual's risk so you can design targeted interventions instead of relying on the prediction score alone.
Associated prediction scores
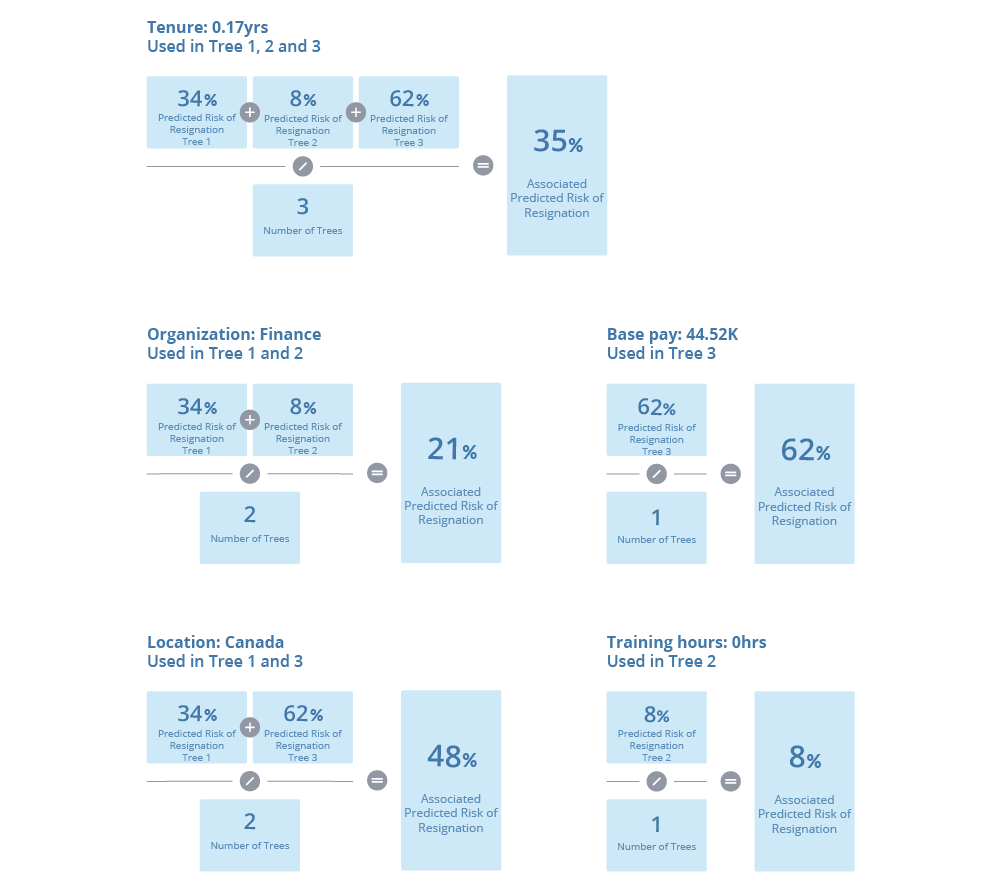
For the top attributes an associated prediction score is calculated by averaging the historical event likelihoods across trees where the attribute was used in the prediction. This is the prediction score if the attribute alone was the most important attribute for the prediction.
When comparing the associated prediction to the actual prediction:
- If the associated prediction is greater than the actual prediction, the attribute is increasing the prediction value.
- If the associated prediction is lower than the actual prediction, the attribute is decreasing the prediction value.
Note: It is not possible to fully explain a prediction based on the top prediction attributes because the result is not based on a list of independently contributing attributes, but on the combination of attributes that were historically most impacting the occurrence of events.
The following is a list of Floyd's top resignation risk attributes:
| Attribute | Value |
|---|---|
| Tenure | 0.17 yrs |
| Location | Canada |
| Organization | Finance |
| Base pay | 44.52K |
| Training hours | 0 hrs |
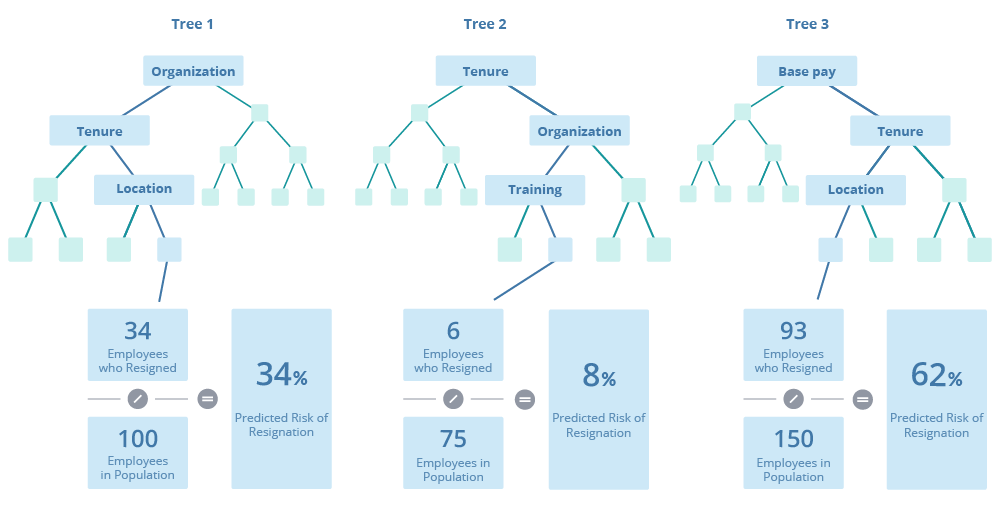
These attributes were used most often to predict Floyd's risk of resignation, as shown in the following illustration.
The associated risk of resignation for these attributes is calculated by averaging the historical event likelihoods across the trees where the attribute was used in the prediction, as shown in the following illustration.