
Predictive Models
Learn how Visier's predictive models are generated and how the predictions are made.
Accurate predictions are the cornerstone of effective workforce analysis and planning. By forecasting how many employees are likely to leave, for instance, you'll be better able to plan for the right number of new employees to hire. Expect too little attrition, and you'll fall behind on hiring and workforce productivity will drop. Expect too much, and you'll waste money ramping up talent acquisition programs. Better predictions make it easier to match workforce supply with demand. Even a small increase in accuracy means significant savings, given that the workforce accounts for the biggest slice of the budget for most organizations.
Visier's predictive models will help you identify employees who are most likely to resign, should be considered for a promotion, or are most likely to internally change jobs. You can also validate and report on how close the number of actual exits, promotions, and internal moves were to the predicted values inside the application. This will help you increase the trust of your stakeholders by confirming exactly how accurate your past predictions were.
How are the predictive models generated?
We use the random forest machine learning technique to generate our predictive models. Visier's learning algorithm examines historical employee data and employee events like promotions, resignations, and internal hires to learn a set of patterns and construct decision trees that help you predict the occurrence of an event. For example, the decision tree, in the following illustration, predicts whether an employee will resign in the next 12 months based on their attributes.
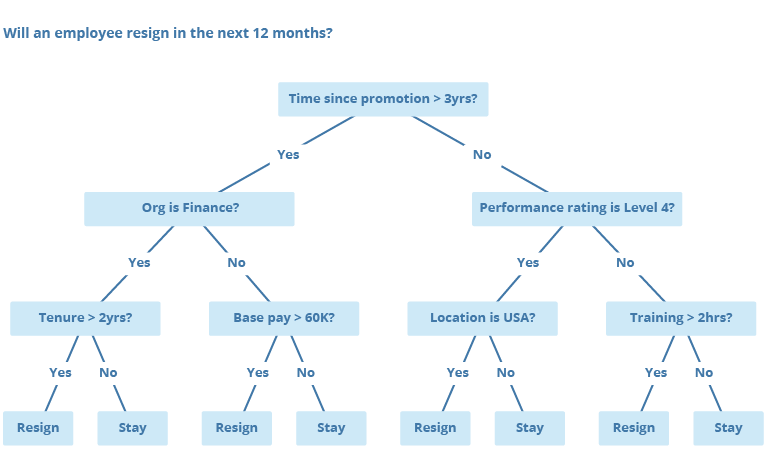
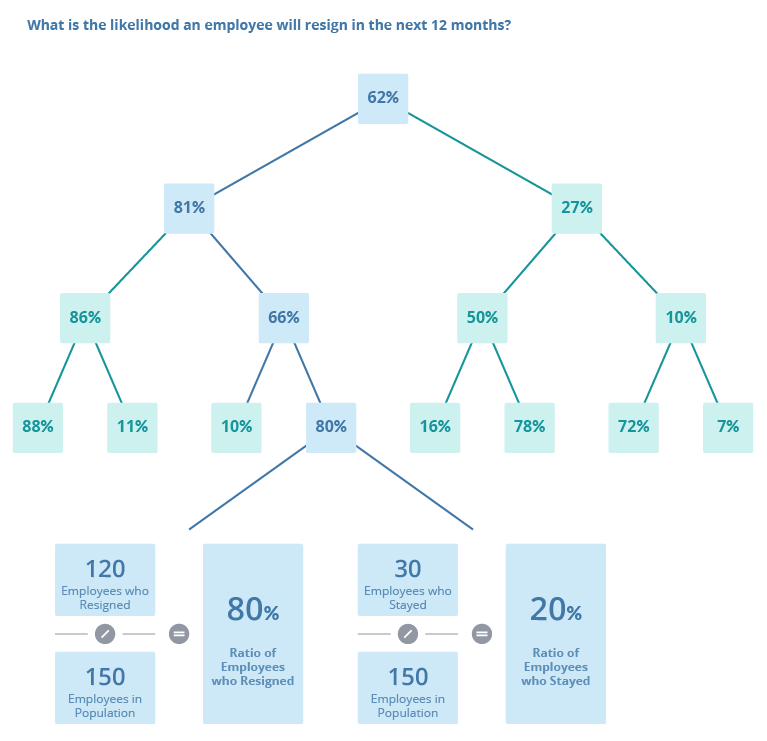
To construct a decision tree, the learning algorithm analyzes the employee data to determine the attribute that best separates the data into two distinct groups. For the previous example, the two distinct groups are the employees who resigned and the employees who stayed. This process is repeated at each node and the tree grows until the stopping criteria is met. The event likelihood is based on the proportion of employees in each group at the leaf node (the end of each path). The following illustration shows how the decision tree is constructed and the risk of resignation is determined (ratio of employees who resigned).
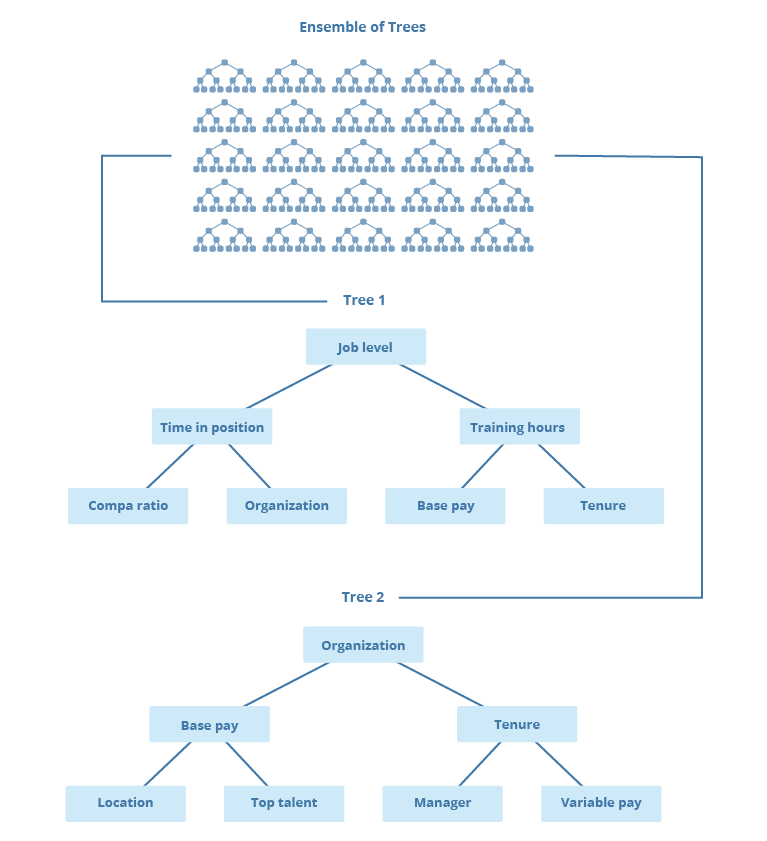
The random forest machine learning technique is based on the idea that an ensemble of decision trees is more accurate than any individual decision tree. Visier's learning algorithm constructs many different decision trees by analyzing a random subset of information about the employee at each split to determine the attribute that best separates the data into two distinct groups. This means that each tree is constructed using a different combination of attributes, as shown in the following illustration.
How are the predictions made?
To make a prediction for an employee, the prediction algorithm:
- Looks at the employee's attributes and determines the employee's path for each tree.
- Averages the historical event likelihoods across the trees.
The following table lists some of Floyd's attributes.
| Attribute | Value |
|---|---|
| Age | 22.2 yrs |
| Tenure | 0.17 yrs |
| Base pay | $44.52K |
| Location | Canada |
| Performance rating | Level 5 |
| Organization | Finance |
| Training hours | 0 hrs |
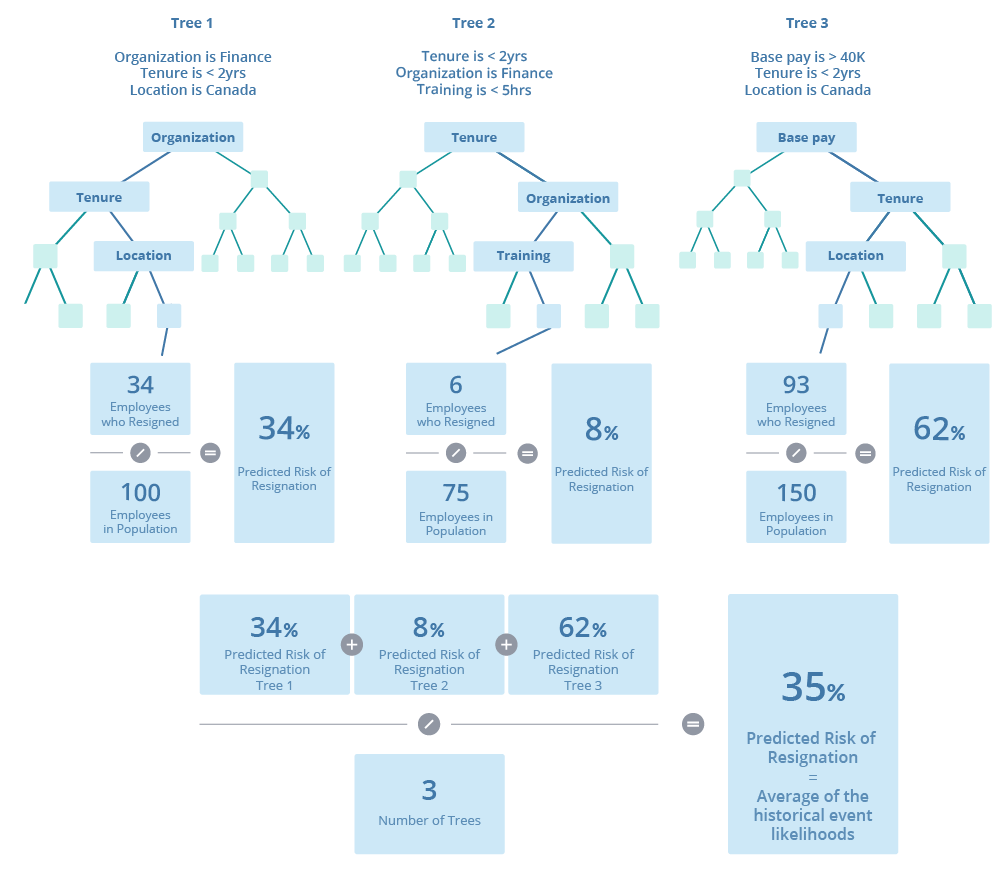
For this example, our predictive model is composed of three decision trees. To predict Floyd's overall risk of resignation, the prediction algorithm looks at Floyd's attributes and determines the path he falls into for each tree. The event likelihood for each tree is based on the chosen path and the population of employees who resigned at the leaf node. An overall risk of resignation is calculated for Floyd by averaging the historical event likelihoods across the trees. The following illustration shows how the Predicted Risk of Resignation model predicts a 35 percent likelihood that Floyd will resign in the next 12 months.
What data is required for the predictive models?
Our predictive models are driven off specific event data. You must provide, load, and configure the following data for the prediction models to work:
| Predictive Model | Required Event Data |
|---|---|
| Predicted Likelihood of Internal Move | Internal Placement, specifically internal hire by placement events. |
| Predicted Likelihood of Promotion | Internal Placement, specifically promotion events. |
| Predicted Risk of Resignation | Employee Exit, specifically resignation events. |
How often are the predictions updated?
Prediction updates occur for both the individual prediction values and the predictive models themselves.
The predictive models that create the prediction values are also subject to regeneration.
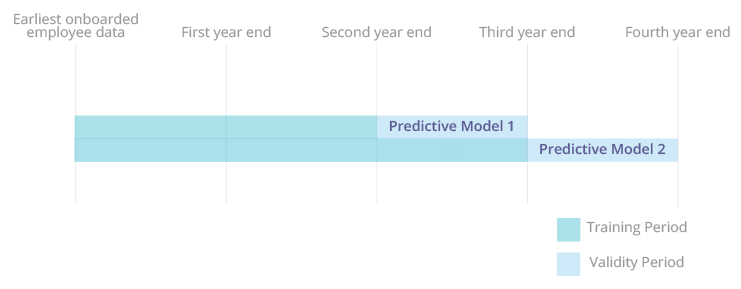
To ensure the predictive model is leveraging all available training data, a new model is generated annually, typically around the end of your organization’s financial year. Each model uses historical data from previous periods, and is valid to create predictions for one year.
It's important to note that individual prediction values may change for the following reasons:
- An employee’s personal attributes have changed, such as location or tenure. For example, let’s say that in March 2022, Floyd McGregor’s location is Canada, and his predicted risk of resignation is 35%. In April 2022, Floyd McGregor moved to Germany, and his predicted risk of resignation changed to 20%, based on his updated location attribute.
- A new predictive model has become valid. For example, even if an employee’s attributes have not changed from one month to the next, the new model will likely produce different prediction values from the previous model, as more data has become available for the model to learn from.
How much data is needed to generate a predictive model?
For predictions to work a total of 24 months of historical data (two fiscal years) must be provided. To accurately validate the predictions, 36 months of historical data is required.
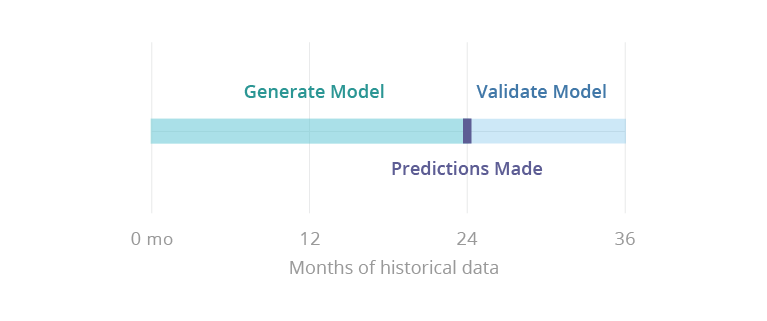
We need at least 24 months of historical data to generate a predictive model. Once the model is generated, predictions will be available in the solution on the 25th month. An additional 12 months of historical data is needed to validate the model and predictions. Once this process is complete, you will be able to self-validate the predictions in the solution on the 37th month. For more information, see Validate Predictions Against Actuals.
Note: You can decrease the minimum training period for the model in the Customize tab of the prediction. However, decreasing the training period from the recommended 24 months will reduce the quality of the predictions. The minimum training period is 13 months.
Frequently asked questions
How do predicted counts work with the Detailed View visual?
The predicted count is calculated by applying the predicted rate of the event for an employee population (for example, actual exits, internal moves, promotions) to the number of employees in that population. The output is rounded to the nearest whole person.
For example, if the predicted rate of the event for a population of 100 employees is 10%, then the predicted count would be 10. Statistically, we expect that 10 of the 100 employees will exit, move, or be promoted in the next year.
When you look at Detailed View for this population, you will see all 100 employees listed even though the predicted count is 10. This is because our methodology uses probabilities and does not specify exactly which 10 people the prediction will apply to. What you will see in Detailed View is a list of employees sorted by their prediction scores. The data is presented this way to allow you to make a fully informed assessment based on a broad understanding of all the employee's attributes.
What are some best practices when configuring the predictive models?
- Include as much employee data as possible. It is safe to include all properties that meet your organization's compliance requirements.
- Include clean data that is free of data artifacts.
- Exclude any sensitive data such as age or gender.
- Exclude backdated data.
- Age and Generation properties can be added at the same time. However, there is no reason to add Generation if Age is already included because there is no additional information provided by Generation.
- Add all compensation properties as base and variable compensation are distinct pieces of information.
- Including only Direct Compensation does not reveal the relative size of the individual compensation segments.
- Include both percentages and absolute amounts for items such as bonuses and long-term incentives and let the predictive model decide what's worth keeping.
For more information about our recommendations, see Strengths and Limitations of the Predictive Models.
Do the predictions take seasonality into account?
No. We currently only support predictions for the following complete year, which makes them insensitive to seasonal changes.
How long are the predictions valid for?
The prediction values are valid for the point in time which the employee attributes used to make the predictions are retrieved. Predictions estimate the likelihood that the target employee event (for example, a resignation) will happen in the 365 days following the prediction.
Are there additional data points that are taken into account?
The predictive algorithm automatically takes into account auxiliary factors (internally calculated properties), which contain information that improves the predictive outcomes. For every prediction, the algorithm will look at the peers (employees with the same direct manager), the direct reports, and the manager of the employee in question to see whether they experienced the predicted event in the previous six months. This means, if 10 properties have been selected for the predictive model, the predictive model will use 13 properties in the predictions. For more information, see Configure the Predictive Models. These internally calculated properties are not included in the top prediction attributes to ensure users are not exposed to information they don’t have permissions for. For more information, see Top Prediction Attributes.
The auxiliary factors can be excluded from the predictive models via the Direct Manager (Supervisory Hierarchy) reference.
How are continuous variables taken into account?
The predictive models take a continuous value such as annual salary rate and creates a series of bins that are defined by a range of values of the actual historic data for that variable. The model does not use any of the ranges that may have been defined for a given variable elsewhere in the solution (for example, custom salary ranges).
How are discrete (categorical) variables taken into account?
Categorical variables have values that can be placed in distinct groups based on a characteristic. For example, Job Family is a categorical variable that can have values such as Specialist, Leader, and Supervisor. Our predictive models will account for all categorical variables including properties that can have many distinct values such as Job Name.
Before we run the categorical variables through the prediction algorithm, we must transform them into numeric values. Based on our research and testing, the best data transformation method was Proportion Encoding, where each property value is given a numeric value based on how frequent it appears in the data.
Each level of a hierarchical dimension (leveled or parent-child) will be used in the predictions. For example, each level of the Location Hierarchy will be included as a separate property:
- North America
- North America, USA
- North America, USA, California
- North America, USA, California, Bay Area