
Data Query API Overview
Learn more about the Data Query API.
Overview
The Data Query API allows you to retrieve data from Visier in aggregate or list form:
- Aggregate: This aggregates data for a single object in Visier, usually across time. For example, you can perform a single aggregation to retrieve your organization's headcount over the last 12 months grouped by Location and filtered by Organization.
- List: This returns a list of values for objects at a specific time. The values are not aggregated. For example, you can perform a list query to retrieve the names of the female employees in your organization at a specific time.
Tip:
- Watch this video for a demo of the Data Query API.
- Check out this tutorial to learn how to Get Aggregated Data Out of Visier.
- Check out this tutorial to learn how to Get a List of Records Out of Visier.
If you use Visier to visualize your data, the above actions have a direct correlation to the interface you see in the solution experience, including the Explore room and the Detailed View visual. The following examples illustrate this relationship.
API comparison to Explore and Detailed View
The below image shows a Breakdown of Headcount by Job Pay Level, filtered to Female employees for July 2020 to September 2020.
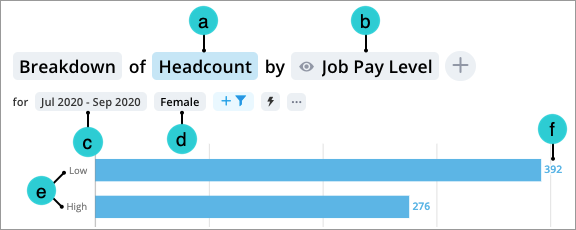
You can retrieve the data shown in the above image using the Data Query API aggregate action. The components in the image correspond to API as follows. For more information, see "Data Query" in API Reference.
-
Metric picker: The metric that you're retrieving data for. In this example, the parameters are:
Copy"source": {
"metric": "employeeCount"
} -
Group By picker: The selection concepts or dimensions that you want to group the data by. In this example, the parameters are:
Copy"axes": [
{
"dimensionMemberSelection": {
"dimension": {
"name": "Pay_Level",
"qualifyingPath": "Employee"
},
"members": [
{ "path": ["Low"] },
{ "path": ["High"] }
]
}
}
] -
Time picker: The time during which the data is valid. In this example, the parameters are:
Copy"timeIntervals": {
"fromDateTime": "2020-10-01",
"intervalPeriodType": "MONTH",
"intervalCount": 3
}Note: If defining
timeIntervalin a list query ortimeIntervalsin an aggregate or snapshot query, thedirectionvalue impacts the meaning of the defined time value (fromDateTimeandfromInstant).- When the direction is
BACKWARD, the specified time value is excluded.- Events that occur on the specified date are excluded.
- If the data is subject-based, data that ends on the specified date is included because the ending event is excluded.
- When the direction is
FORWARD, the specified time value is included.
The default direction is
BACKWARD. This means the platform queries backwards from the specified time. You can definedirection: FORWARDto query forwards from the specified time.For aggregate query results, Visier returns the technical member name for time; for example,
2019-06-01T00:00:00.000Z - [0]. You can request"options": { "memberDisplayMode": "DISPLAY" }for aggregate queries to return time members with a display name matching the caller's locale; for example,May 31, 2019. - When the direction is
-
Filter picker: The values to include or exclude from the data. In this example, the parameters are:
Copy"filters": [
{
"selectionConcept": {
"name": "isFemale",
"qualifyingPath": "Employee"
}
}
] -
Group: The groups that the data members belong to, as defined by the group by. In this example, the parameters are:
Copy"axes": [
{
"dimensionMemberSelection": {
"dimension": {
"name": "Pay_Level",
"qualifyingPath": "Employee"
},
"members": [
{ "path": ["Low"] },
{ "path": ["High"] }
]
}
}
] -
Value: The aggregated value for the query returned by the response.
The next image shows the Detailed View information for the Headcount of female employees for September 2020.
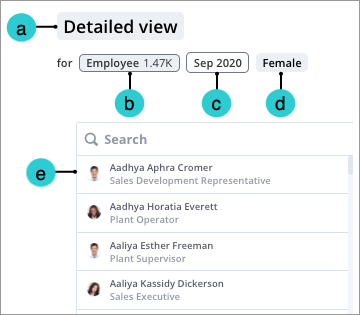
You can retrieve the data shown in the above image using the Data Query API list action. The components in the image correspond to the API as follows:
- Detailed View: The underlying set of subject members or event occurrences that make up a given population. For more information, see "Query a list of details" in API Reference. In this example, the request URL is: POST https://jupiter.api.visier.io/v1/data/query/list.
-
Subject: The subject associated with the metric. In this example, the parameters are:
Copy"source": {
"metric": "employeeCount"
} -
Time picker: The time during which the data is valid. In this example, the parameters are:
Copy"timeIntervals": {
"fromDateTime": "2020-10-01",
"intervalPeriodType": "MONTH",
"intervalCount": 1
}Note: If defining
timeIntervalin a list query ortimeIntervalsin an aggregate or snapshot query, thedirectionvalue impacts the meaning of the defined time value (fromDateTimeandfromInstant).- When the direction is
BACKWARD, the specified time value is excluded.- Events that occur on the specified date are excluded.
- If the data is subject-based, data that ends on the specified date is included because the ending event is excluded.
- When the direction is
FORWARD, the specified time value is included.
The default direction is
BACKWARD. This means the platform queries backwards from the specified time. You can definedirection: FORWARDto query forwards from the specified time.For aggregate query results, Visier returns the technical member name for time; for example,
2019-06-01T00:00:00.000Z - [0]. You can request"options": { "memberDisplayMode": "DISPLAY" }for aggregate queries to return time members with a display name matching the caller's locale; for example,May 31, 2019. - When the direction is
-
Filter: The values to include or exclude from the data. In this example, the parameters are:
Copy"filters": [
{
"selectionConcept": {
"name": "isFemale",
"qualifyingPath": "Employee"
}
}
] -
Value: The list of values returned by the response.
Find available objects to use in an API request
To use a specific object in an API request, you must know the unique identifier of the object. For example:
- To query the pay levels of your employees, you must know the Pay Level dimension's ID.
- To commit a project, you must know the project ID.
- To check an extraction job's status, you must know the dispatching job ID.
Use APIs to retrieve unique identifiers for available objects. For example, retrieve all dimensions to find the ID of Pay Level.
Example: I want to retrieve Customer Support and Dev Operations employees by pay level
Let's say you want to query the Headcount metric filtered by Function employees and grouped by Pay Level. This query involves several objects:
- Metric: Headcount
- Analytic object: Employee
- Dimensions: Function, Pay Level
- Dimension members: Function: Customer Support, Dev Operations and Pay Level: Pay Level.
To make an API request, you need the unique IDs of the metric, analytic object, and dimensions, and the paths of the dimension members.
Find metrics
First, you need to know the unique ID of Headcount. Headcount is a metric, so you'll retrieve all metrics.
curl -X GET --url 'https://{vanity_name}.api.visier.io/v1/data/model/metrics' \
-H 'apikey:{api_key}'
-H 'Cookie:VisierASIDToken={security_token}'The response returns all the metrics in your tenant. As shown in the sample response, the id for Headcount is employeeCount.
 View sample response
{
"metrics": [
{
"id": "employeeCount",
"displayName": "Headcount",
"description": "The number of employees in the organization.",
"dataStartDate": "1522627200000",
"dataEndDate": "1604102400000",
"analyticObject": "Employee",
"parameters": [],
"category": "REGULAR",
"visibleInApp": true,
"dataType": "Integer"
}
...
]
}Find analytic objects and dimensions
In this example, the IDs are the same as the display names. That is, the unique IDs are Employee, Function, and Pay_Level. However, sometimes IDs are less obvious. If you don't know the IDs, call these endpoints:
- Retrieve analytic objects: GET /v1/data/model/analytic-objects. This returns the subjects, events, and overlays in your tenant, such as Employee.
- Retrieve dimensions: GET /v1/data/model/analytic-objects/Employee/dimensions. This returns the Employee dimensions in your tenant, such as Function and Pay Level.
The responses are similar to the metrics response above. In the response body, find the id field.
Find dimension members
Next, find the dimension members to filter and group by in the API request. Because there are two dimensions, you have to make two requests.
curl -X GET --url 'https://{vanity_name}.api.visier.io/v1/data/model/analytic-objects/Employee/dimensions/Function/members' \
-H 'apikey:{api_key}' \
-H 'Cookie:VisierASIDToken={security_token}'The path to Function dimension members are identified in the path field, as shown in the following response.
View sample response
{
"members": [
{
"fullName": "[Function].[All Functions]",
"displayName": "Overall",
"level": 0,
"path": [],
"validityRanges": []
},
{
"fullName": "[Function].[]",
"displayName": "Unknown",
"level": 1,
"path": [
""
],
"validityRanges": []
},
{
"fullName": "[Function].[Customer Support]",
"displayName": "Customer Support",
"level": 1,
"path": [
"Customer Support"
],
"validityRanges": []
},
{
"fullName": "[Function].[Dev Operations]",
"displayName": "Dev Operations",
"level": 1,
"path": [
"Dev Operations"
],
"validityRanges": []
},
{
"fullName": "[Function].[E-Commerce]",
"displayName": "E-Commerce",
"level": 1,
"path": [
"E-Commerce"
],
"validityRanges": []
},
{
"fullName": "[Function].[Finance]",
"displayName": "Finance",
"level": 1,
"path": [
"Finance"
],
"validityRanges": []
},
{
"fullName": "[Function].[HR]",
"displayName": "HR",
"level": 1,
"path": [
"HR"
],
"validityRanges": []
},
{
"fullName": "[Function].[IT]",
"displayName": "IT",
"level": 1,
"path": [
"IT"
],
"validityRanges": []
},
{
"fullName": "[Function].[Marketing]",
"displayName": "Marketing",
"level": 1,
"path": [
"Marketing"
],
"validityRanges": []
},
{
"fullName": "[Function].[Office of CEO]",
"displayName": "Office of CEO",
"level": 1,
"path": [
"Office of CEO"
],
"validityRanges": []
},
{
"fullName": "[Function].[Operations]",
"displayName": "Operations",
"level": 1,
"path": [
"Operations"
],
"validityRanges": []
},
{
"fullName": "[Function].[Product]",
"displayName": "Product",
"level": 1,
"path": [
"Product"
],
"validityRanges": []
},
{
"fullName": "[Function].[Sales]",
"displayName": "Sales",
"level": 1,
"path": [
"Sales"
],
"validityRanges": []
},
{
"fullName": "[Function].[Software Engineering]",
"displayName": "Software Engineering",
"level": 1,
"path": [
"Software Engineering"
],
"validityRanges": []
},
{
"fullName": "[Function].[Software Testing]",
"displayName": "Software Testing",
"level": 1,
"path": [
"Software Testing"
],
"validityRanges": []
}
]
}Because you want to group by all pay levels, not specific pay levels, you can retrieve the dimension information of Pay Level to retrieve the overall level that contains all pay levels.
curl -X GET --url 'https://{vanity_name}.api.visier.io/v1/data/model/analytic-objects/Employee/dimensions/Pay_Level' \
-H 'apikey:{api_key}' \
-H 'Cookie:VisierASIDToken={security_token}'The response returns the levels Level 0 and Job Pay Level. In this example, Job Pay Level is the level to query.
View sample response
{
"dimensions": [
{
"id": "Pay_Level",
"displayName": "Job Pay Level",
"description": "The pay level or pay grade of the specified job.",
"levels": [
{
"id": "(All)",
"displayName": "Level 0"
},
{
"id": "Pay_Level",
"displayName": "Job Pay Level",
"depth": 1
}
],
"unknownMember": [
"-1.0"
],
"memberCount": 18,
"visibleInApp": true,
"tags": [
{
"id": "Organization_General",
"displayName": "Organization"
}
]
}
]
}Write the Data Query API request
Finally, put it all together. To craft the Data Query API request, use the IDs, members, and levels to specify the exact conditions of your query.
curl -X POST --url 'https://{vanity_name}.api.visier.io/v1/data/query/aggregate' \
-H 'apikey:{api_key}' \
-H 'Cookie:VisierASIDToken={security_token}' \
-H 'Content-Type: application/json' \
-d '{
"query": {
"source": {
"metric": "employeeCount"
},
"timeIntervals": {
"intervalCount": 3,
"dynamicDateFrom": "SOURCE"
},
"filters": [{
"memberSet": {
"dimension": {
"name": "Function",
"qualifyingPath": "Employee"
},
"values": {
"included": [{
"path": ["Dev Operations"]
},{
"path": ["Customer Support"]
}]
}
}
}],
"axes": [
{
"dimensionLevelSelection": {
"dimension": {
"name": "Pay_Level",
"qualifyingPath": "Employee"
},
"levelIds": [
"Pay_Level"
]
}
}
]
}
}'The response returns the Headcount values for each Pay Level.
View sample response
{
"cells": [
{
"value": "0",
"support": "0",
"coordinates": [
0,
0,
0
]
},
{
"value": "0",
"support": "0",
"coordinates": [
0,
0,
1
]
},
{
"value": "177",
"support": "177",
"coordinates": [
0,
0,
2
]
},
{
"value": "177",
"support": "177",
"coordinates": [
0,
0,
3
]
},
{
"value": "85",
"support": "85",
"coordinates": [
0,
0,
4
]
},
{
"value": "81",
"support": "81",
"coordinates": [
0,
0,
5
]
},
{
"value": "20",
"support": "20",
"coordinates": [
0,
0,
6
]
},
{
"value": "0",
"support": "0",
"coordinates": [
0,
0,
7
]
},
{
"value": "0",
"support": "0",
"coordinates": [
0,
0,
8
]
},
{
"value": "0",
"support": "0",
"coordinates": [
0,
0,
9
]
},
{
"value": "54",
"support": "54",
"coordinates": [
0,
0,
10
]
},
{
"value": "1",
"support": "1",
"coordinates": [
0,
0,
11
]
},
{
"value": "2",
"support": "2",
"coordinates": [
0,
0,
12
]
},
{
"value": "0",
"support": "0",
"coordinates": [
0,
0,
13
]
},
{
"value": "0",
"support": "0",
"coordinates": [
0,
0,
14
]
},
{
"value": "0",
"support": "0",
"coordinates": [
0,
0,
15
]
},
{
"value": "0",
"support": "0",
"coordinates": [
0,
0,
16
]
},
{
"value": "0",
"support": "0",
"coordinates": [
0,
1,
0
]
},
{
"value": "0",
"support": "0",
"coordinates": [
0,
1,
1
]
},
{
"value": "178",
"support": "178",
"coordinates": [
0,
1,
2
]
},
{
"value": "174",
"support": "174",
"coordinates": [
0,
1,
3
]
},
{
"value": "84",
"support": "84",
"coordinates": [
0,
1,
4
]
},
{
"value": "81",
"support": "81",
"coordinates": [
0,
1,
5
]
},
{
"value": "21",
"support": "21",
"coordinates": [
0,
1,
6
]
},
{
"value": "0",
"support": "0",
"coordinates": [
0,
1,
7
]
},
{
"value": "0",
"support": "0",
"coordinates": [
0,
1,
8
]
},
{
"value": "0",
"support": "0",
"coordinates": [
0,
1,
9
]
},
{
"value": "53",
"support": "53",
"coordinates": [
0,
1,
10
]
},
{
"value": "1",
"support": "1",
"coordinates": [
0,
1,
11
]
},
{
"value": "2",
"support": "2",
"coordinates": [
0,
1,
12
]
},
{
"value": "0",
"support": "0",
"coordinates": [
0,
1,
13
]
},
{
"value": "0",
"support": "0",
"coordinates": [
0,
1,
14
]
},
{
"value": "0",
"support": "0",
"coordinates": [
0,
1,
15
]
},
{
"value": "0",
"support": "0",
"coordinates": [
0,
1,
16
]
},
{
"value": "0",
"support": "0",
"coordinates": [
0,
2,
0
]
},
{
"value": "0",
"support": "0",
"coordinates": [
0,
2,
1
]
},
{
"value": "176",
"support": "176",
"coordinates": [
0,
2,
2
]
},
{
"value": "177",
"support": "177",
"coordinates": [
0,
2,
3
]
},
{
"value": "84",
"support": "84",
"coordinates": [
0,
2,
4
]
},
{
"value": "81",
"support": "81",
"coordinates": [
0,
2,
5
]
},
{
"value": "21",
"support": "21",
"coordinates": [
0,
2,
6
]
},
{
"value": "0",
"support": "0",
"coordinates": [
0,
2,
7
]
},
{
"value": "0",
"support": "0",
"coordinates": [
0,
2,
8
]
},
{
"value": "0",
"support": "0",
"coordinates": [
0,
2,
9
]
},
{
"value": "54",
"support": "54",
"coordinates": [
0,
2,
10
]
},
{
"value": "1",
"support": "1",
"coordinates": [
0,
2,
11
]
},
{
"value": "2",
"support": "2",
"coordinates": [
0,
2,
12
]
},
{
"value": "0",
"support": "0",
"coordinates": [
0,
2,
13
]
},
{
"value": "0",
"support": "0",
"coordinates": [
0,
2,
14
]
},
{
"value": "0",
"support": "0",
"coordinates": [
0,
2,
15
]
},
{
"value": "0",
"support": "0",
"coordinates": [
0,
2,
16
]
}
],
"axes": [
{
"dimension": {
"name": "Measures",
"qualifyingPath": ""
},
"positions": [
{
"path": [
"MeasureName"
]
}
]
},
{
"dimension": {
"name": "DateInRange",
"qualifyingPath": ""
},
"positions": [
{
"path": [
"2026-05-01T00:00:00.000Z - [0]"
]
},
{
"path": [
"2026-06-01T00:00:00.000Z - [1]"
]
},
{
"path": [
"2026-06-15T21:51:15.567Z - [2]"
]
}
]
},
{
"dimension": {
"name": "Pay_Level",
"qualifyingPath": ""
},
"positions": [
{
"path": [
"3.0"
]
},
{
"path": [
"4.0"
]
},
{
"path": [
"5.0"
]
},
{
"path": [
"6.0"
]
},
{
"path": [
"7.0"
]
},
{
"path": [
"8.0"
]
},
{
"path": [
"9.0"
]
},
{
"path": [
"10.0"
]
},
{
"path": [
"11.0"
]
},
{
"path": [
"12.0"
]
},
{
"path": [
"13.0"
]
},
{
"path": [
"14.0"
]
},
{
"path": [
"15.0"
]
},
{
"path": [
"19.0"
]
},
{
"path": [
"20.0"
]
},
{
"path": [
"999.0"
]
},
{
"path": [
"-1.0"
]
}
]
}
]
}