
Create an Email Push Schedule
Schedule when analyses are emailed to users.
Access requirements
Permission with these capabilities: Schedule Analysis and Share Analysis
Reach out to your administrator for access.
- To create an email push schedule, do one of the following:
Option Do this For an analysis that you own On the navigation bar, click Analyses
 .
.- Hover over the analysis you want to send and then click the Add Schedule button
 in the Quick Actions menu.
 - Select the analysis you want to send and then click the Schedule email delivery button in the upper-right corner.
For a guidebook topic - On the navigation bar, click Guidebooks
 .
. - In the Guidebooks room, select the topic you want to send and then click the Schedule email delivery button in the upper-right corner.
For Embedded analytic tenants - In an administrating tenant, open the production project.
- On the navigation bar, click Model > Analyses.
- Hover over the analysis you want to send and then click the Add Schedule button .
Note: To create an email push schedule for an analysis, the analysis must be published to production. For more information, see Publish Project Changes.
- In the Schedule details section of the Send analysis by email dialog, type a name for the schedule. Recipients will see the name of the schedule when unsubscribing.
- Select a delivery option:
- Select Deliver now to immediately send the analysis to users.
- Select Recurrent and set the frequency (weekly or monthly) that the analysis will be sent to users.
- Select Custom and select the specific dates that the analysis will be sent to users.
-
If you are scheduling the analysis to be sent later (recurrent or custom), set the date and time.
Note:
- When setting a recurrent delivery:
- The start date defines the earliest date that the delivery schedule is active.
- If you are using a monthly schedule, ensure you select a date that occurs each month. Analyses will not be sent if the scheduled date does not occur in the month (for example, the 31st of each month).
- The start time determines when emails are processed for delivery. The actual delivery time depends on processing time and server load. Set the start time to align with data loads and regular business hours.
- Email push schedules are not automatically adjusted for daylight savings time.
- When setting a recurrent delivery:
- Set the parameter values. In the email that users receive, the parameter value you set is used. The recipient will not be able to change the parameter value if they open the analysis.
Note: If parameters aren’t configured for the analysis, this option isn’t available. For more information about parameters in analyses, see Create a Dynamic Template.
- Optional: Set a conditional delivery rule. Analysis emails will only be sent if the rule is met.
Note:
- The delivery rule will be evaluated for each recipient and is based on the data the recipient sees.
- For example, you've set a delivery rule to send an analysis email if the Turnover Rate is Greater than 20%. The recipients are Miriam and Susie. When the email is scheduled to be sent, let's say the Turnover Rate that Miriam sees is 10% and the Turnover Rate that Susie sees is 40%. The analysis email will be sent to Susie because their Turnover Rate is greater than 20%.
- The rules will be evaluated based on the data refresh settings and time context (time period and granularity) of the analysis. For example, let's say you have an analysis that is scheduled to be sent out on a recurrent basis and it's set to update to the latest complete time period at a monthly granularity. Before the email is sent, the rules will be evaluated using data from the latest complete month.
- However, if the analysis is set to show data for a fixed point in time (time period as captured or a specific time period), the rules will be evaluated using the latest data for the selected granularity. For example, let's say you have an analysis that is set to show data from a specific time period at a monthly granularity (October 2020), and the latest data you've loaded is December 20, 2021. Before the email is sent, the rules will be evaluated using data from the latest month (December 2021).
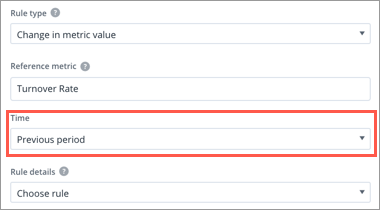
- In the Rule type list, select one of the following rule types
Rule Description Example Metric value Send an analysis email based on a target value. If the Turnover Rate is Greater than 20%, send the analysis email. Change in metric value Send an analysis email based on the percentage change in a metric over time. If the percentage change in the Turnover Rate is Greater than 5% from the previous period, send the analysis email. Difference from group Send an analysis email based on the percentage change in a metric for a specific population. If the percentage change between the Turnover Rate and the Turnover Rate for Women is Greater than 10%, send the analysis email. Difference from metric overall Send an analysis email based on the percentage change between two metrics.
The reference metric value is evaluated against the overall value of the comparison metric.
If the percentage change between the Minority Ratio in US and the Minority Ratio - My EEOC Benchmark is Greater than 10%, send the analysis email. Note: For more information about the percentage change calculation, see How the difference between two metric values is calculated.
- Depending on the rule type you selected, do the following:
Rule Do this Metric value Select the metric that will be evaluated by clicking the Reference metric box.
Change in metric value Select the metric that will be evaluated by clicking the Reference metric box.
- Click the Time list to set the time period for comparison.
Difference from group Select the metric that will be evaluated by clicking the Reference metric box.
- Under Group filters, click Add filter and select the attribute values that define the population for comparison.
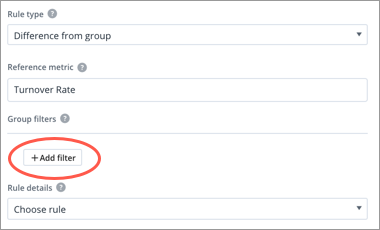
- Repeat step ii. to add additional filters.
Difference from metric overall Select the reference and comparison metrics. The reference metric will be evaluated against the comparison metric.
- In the Rule details list, select the condition and then type the target value. For example, Less than 50, Between 40% and 50%, or Greater than 20%.
- The delivery rule will be evaluated for each recipient and is based on the data the recipient sees.
- Under Email details, set up and compose the email:
- Type a subject line.
- Type a message that will accompany the analysis.
- In the Reply-to email box, type an email address at which you want to receive replies.
Tip:
Use the following tags to insert dynamic text in the subject line or body of the email. Ensure the tags are written in all uppercase letters.
- [ANALYSIS] inserts the name of the analysis.
- [RECIPIENT] inserts the recipient's user name.
- [SCHEDULE] inserts the name of the schedule.
-
Under Recipients, select the user or user groups you want to send the analysis to.
Note:
- You can send analyses to external users who don't have a Visier account by typing their email and clicking Add External User. To enable this feature, contact Visier Technical Support.
-
The content that is included in the email will depend on whether or not the recipient has a Visier account:
- If the recipient is a Visier user, they will see content that is based on their security settings, applied default context, dynamic filters, and user preferences such as display currency. They will only see the data that they are allowed to see.
- If the recipient is an external user who doesn’t have access to Visier, they will see content that is based on the sender's security settings, applied default context, dynamic filters, and user preferences such as display currency. If you're the sender, external users will see the same data you'll see.
- When finished, click Send.
For more information about managing your email push schedule, see Manage Email Push Schedules in the Analyses Room.
Scheduling email push for Embedded analytic tenants
- Follow steps 1 to 7 above.
- If scheduling an email push for analytic tenants, under Recipients, define the analytic tenants that will receive this email by selecting one of the following:
- Filter by Category: Add the modules and industry codes that you want to receive this email. Users in tenants with any of the specified modules or industry codes will receive the email.
Note:
- Modules are the containers for different types of content, such as Organization and Talent Acquisition. Industry codes are the NAICS codes that classify a business into a specific industry.
- If you add a combination of modules and industry codes, the user must meet the criteria for at least one module and at least one industry code to receive the email.
- To select one specific industry, enter a 6-digit NAICS code. If you enter a code that is less than 6 digits, the platform will select all tenants with industry codes that start with the entered digits. For example, if you enter 123, the platform selects the industry codes 123, 1234, 12345, 123456, and so on.
- The industry code 0 selects all tenants without an industry code.
- Filter by Tenant: Add the tenants that you want to receive this email. Users in the specified tenants will receive the email.
- Filter by Category: Add the modules and industry codes that you want to receive this email. Users in tenants with any of the specified modules or industry codes will receive the email.
- Optional: If sending to analytic tenants, you can further refine the recipients by selecting user groups in the User Groups filter. User group users who meet the criteria for the category filter or tenant filter will receive the email.
- When finished, click Send.
Caution: Email schedule limits
- Analyses emails will not be sent if any of the following limits are exceeded:
- The maximum number of tenants is 800.
- If you exceed 800 tenants, try the following:
- Split up the email schedule, such as assigning half the tenants to one email schedule and the other half to a second schedule.
- Make the filter criteria more specific to reduce the number of tenants.
- Analyses emails will not be sent if any of the following limits are exceeded:
Note: If blank, the email schedule will send to all enabled users who have not opted out of emails.
For more information about managing your email push schedule, see Manage Email Push Schedules in the Analyses Room.
Configuration requirements for Embedded Partners
In order for this feature to work correctly, ensure your technical integration team has:
- Provided Visier with email addresses for the users of your analytic tenants.
- Configured the click-through link in Visier.
How the difference between two metric values is calculated
When comparing metric values using percentages, the relative difference is calculated by subtracting the primary (reference) metric from the secondary (comparison) metric, and then dividing the difference by the secondary metric.
For example, you want to compare the overall Turnover Rate to the Turnover Rate for women, where:
- The overall Turnover Rate is 10.0% (primary metric)
- The Turnover Rate for Women is 30.0% (secondary metric)
The relative difference or percentage change is calculated as follows:
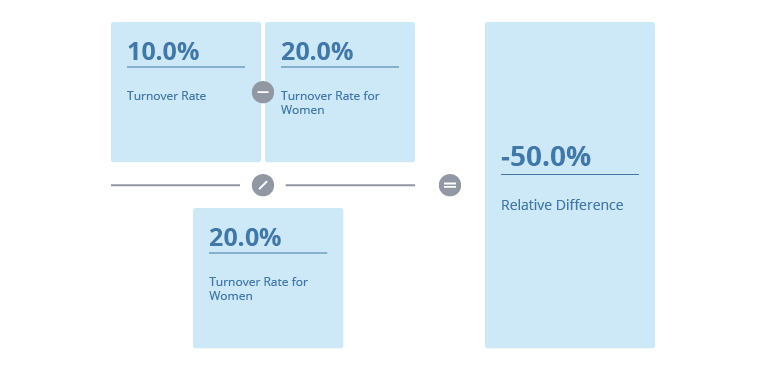
This formula is also used when evaluating the conditional rules for analysis email delivery and traffic lighting.