Use the Comparison Grid
Set up the comparison grid to surface data about employees, candidates, requisitions, and more in the Compare room.
Access requirements
Permission with these capabilities: Compare
Reach out to your administrator for access.
Just like other visualizations, you can change the context to select the population and time period for analysis.
- Filters will be applied to all groups that are in the comparison grid. If there is a conflict or overlap between filters, the local context at the group level will take precedent.
- The default time context is set to the latest period.
Set up the comparison grid
- On the navigation bar, click Compare
 .
.Tip: If you see employees in the comparison grid, click the Reset button
 to start over.
 - In the Subject list, click Employee.
- In the Search box, type a name or employee ID and select the employee from the search results.
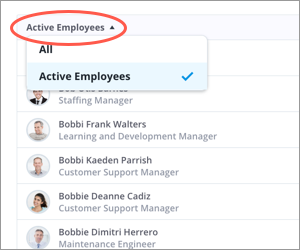
By default, only active subject members will be included in the search results. If you want to analyze a former employee in the Compare room, change the filter in the upper-left corner of the search results from Active Employees to All.
A greyed out photo indicates an inactive subject member in the Compare room. The word inactive will also be appended to their name.
Result: The comparison grid appears.
Open the Compare to panel
- Click the Add comparison button
 on the Visual Actions menu.
Add an employee to the comparison grid
- In the Compare to panel, type a name or employee ID in the Search box and select the employee from the search results.
By default, only active subject members will be included in the search results. If you want to analyze a former employee in the Compare room, change the filter in the upper-left corner of the search results from Active Employees to All.
A greyed out photo indicates an inactive subject member in the Compare room. The word inactive will also be appended to their name.
You can also add employees to the comparison grid outside of the Compare room by doing one of the following:
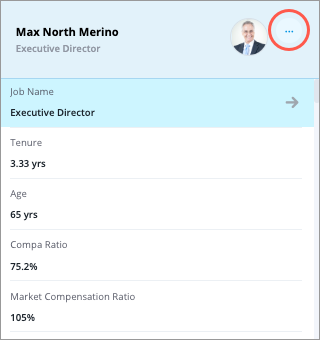
- In Detailed View select the subject member you want to add to the Compare room. In the column header, click the More actions button
 > Add to compare.
- If your data point has five or fewer members in the population, you can quickly add employees to the Compare room in the Members section in the Insights tab of the Info panel.
- To add an individual employee to the Compare room, click the More actions button > Add to Compare.
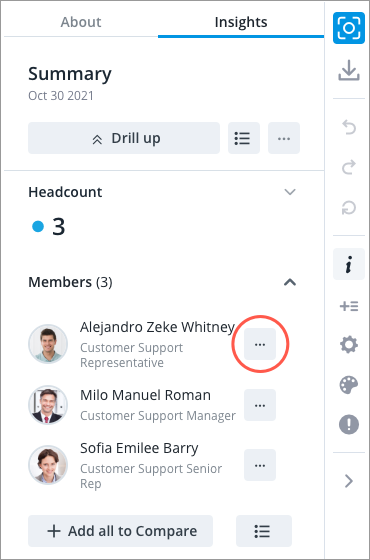
- To add all employees at once to the Compare room, click Add all to Compare.
Note:
For the Members section to appear, the following criteria must be met:
- Users must have the View Details capability.
- There must be five or fewer members in the population for the selected data point.
- The visual does not contain any comparisons. For example, the Members section will not appear if you are comparing metrics or groups.
- The visual does not contain any metrics that use a calculation concept. For example, Total Cost of Workforce or Movement metrics.
- To add an individual employee to the Compare room, click the More actions button
Add a group to the comparison grid
To fully understand a situation, you should compare an individual against their direct peers, their employee group, and similar employees across the business. You can manually define the group or have one automatically generated for you.
Tip: To view a list of subject members or event occurrences that make up a group, click View details in the column header.
Create and add a group
- In the Compare to panel, click Group.
- Click Add filter.
-
In the Filter picker, select the attribute values that define the population.
Note: Using the Filter picker in full screen
- Attribute values can be arranged into levels, so you may have to drill through multiple levels to find the value you want to include or exclude.
- Switch between the include and exclude option by clicking the Include/Exclude arrow.

- For more information, see Selecting the attribute values.
- When finished, click Apply.
- Optional: Repeat steps 2 to 4 to add additional filters.
- Click Add.
Add a similar group (find similar)
Automatically generate and add a group with similar attributes to an individual in the comparison grid.
Note:
- The set of attributes (important properties) that are considered when finding a similar group can be customized in Studio.
- By default these attributes have been configured for the Employee subject. Contact Visier Technical Support to customize the set of attributes for each subject.
- To customize the set of attributes, select the Important Properties for the subject (Applicant, Employee, Requisition) in the Population tab of an analytic object. For more information, see Configure AI Attributes.
- The similar group will only draw from the subject members (employees) that you have access to.
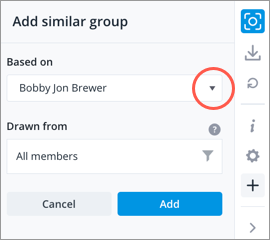
- In the Compare to panel, click Similar Group.
- Optional: Select the employee that you want the similar group to be based on. The first member in the comparison grid will automatically be selected as the member of interest. If there are multiple employees in the comparison grid, you can select the employee that you want to find a similar group for from the Based on list.
Note:
- The employee must be in the comparison grid.
- The employee must be an active employee during the selected time period.
- Optional: Narrow the scope population by clicking the Create the population button
 in the Drawn from box. The scope population is the subset of members that will be considered when generating the similar group. For example, if you only want to find similar employees in the US, you can add a filter for Location Hierarchy: United States.
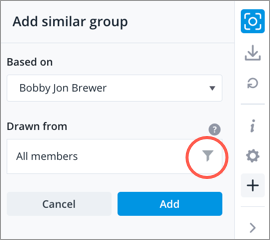
- Click Add filter in the Narrow the population panel.
In the Filter picker, select the attribute values that define the population.
Note: Using the Filter picker in full screen
- Attribute values can be arranged into levels, so you may have to drill through multiple levels to find the value you want to include or exclude.
- Switch between the include and exclude option by clicking the Include/Exclude arrow.
- For more information, see Selecting the attribute values.
- When finished, click Apply.
- Repeat steps a to c to add additional filters.
- Click Save changes.
- Click Add in the Add similar group panel.
Result: The model will take into account the attributes (important properties) selected in Studio, the member of interest, and your data access to find a similar group. If you get the Too many members drawn from all members error message, you must add filters to narrow the scope population.
How Visier finds similar groups
To train our Similarity Model, Visier's algorithm examines your historical data to determine how attribute values are related to each other. For example, when looking at the historical data for the Job Name attribute, we observed the movement of 50 Junior Software Developers. 48 of them became Senior Software Developers and 2 became Product Managers. As a result, the algorithm considers Junior Software Developers to be more related to Senior Software Developers than Product Managers. The model will use this information to identify similar subject members.
Remove an employee or group from the comparison grid
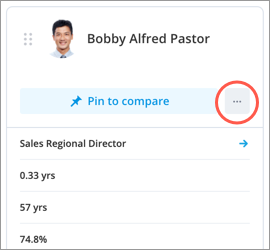
- In the column header, click the More actions button and then click Remove.
Add or remove attributes
- Click the Settings button
 on the Visual Actions menu. For more information, see Attribute Sets.
Rearrange the comparison grid
- In the column header, click the Move icon
 , and drag the column to the desired position.
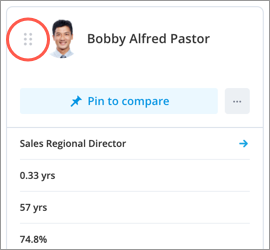
Reset the comparison grid
- To clear the comparison grid and start over, click the Reset button .
Undo or redo an action
- To undo your last action, click the Undo button
 .
. - To redo your last action, click to Redo button
 .
.
For more information, see Undo and Redo Visual Actions.
Calculate differences between attribute values
Pin a subject member to calculate the differences between other subject members and groups in the comparison grid. The subject member is used as the baseline for the comparisons. The difference from the group median is calculated for the subject member when comparing a subject member to a group.
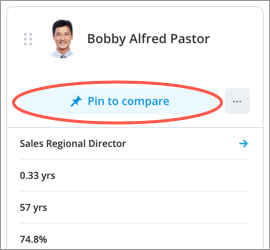
- In the column header of the employee you want to use as the baseline for your comparison, click Pin to compare.
Result: Attribute values are replaced in the comparison grid. Calculated differences will appear for individual comparisons and Distribution visuals will appear for group comparisons.
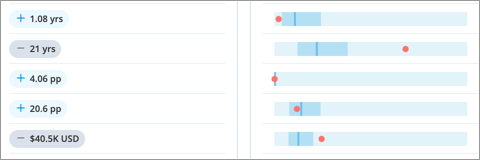
- Click the distribution to view the visual in full screen.
- Hover over the calculated values to find more information about the data point.
Capture the comparison grid
- Click the Capture button
 on the Visual Actions menu.
Go to the Career Paths visual
When analyzing employees in the Compare room, you can quickly switch to the Career Paths visual to explore an employee's career opportunities based on their current role.
Do one of the following:
- In the header, click the More actions button > View Career Path.
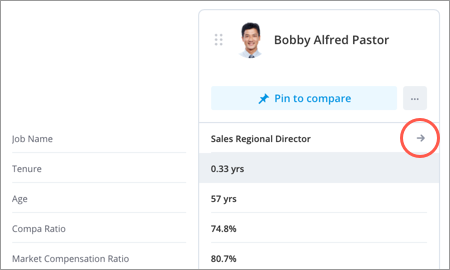
- Find the Job Name attribute and click the View Career Path arrow on the right side of the employee's job name.
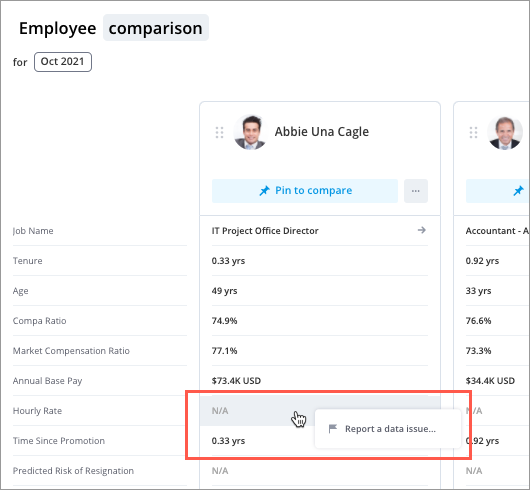
Report a data issue
Access requirements
Permission with these capabilities: Flag and Fix
Reach out to your administrator for access.
For more information about this workflow, see Report a Data Issue.
To report a data issue for an attribute:
-
Right-click the attribute value you want to report and then click Report a data issue.