
Metrics
Types of metrics that can be found in the solution experience and their characteristics.
Overview
A metric is a business concern that can be quantified as a number. For example, Headcount, or the number of active employees in your organization, is a business concern (how many people do we have?) that is quantified as a number (we have 5000 active employees). Metrics are based on one or more analytic objects (subjects, events, or overlays) and perform an aggregation to return a result.
Metrics are important for analysis because they can help you track execution, performance, and other important business concerns. You can explore all of your metrics and perform analytics in the Explore room. For more information, see Explore.
If you're interested in creating your own metrics in Studio, see Create a Metric.
Metric types
Metric can come in different types, the most common types you will encounter in the solution experience are count, rate, and ratio. The metric type affects how the metric values are displayed.
Count
Count metrics count the number of things. For example, the metric Headcount is the number of employees who are working for your organization.
Rate
Rate metrics show how often something is happening within a given time period. For example, the metric Resignation Rate is the percentage of employees who resigned in a given time period.
Ratio
Ratio metrics show the percentage of a population defined by a particular dimension. For example, the metric Employee Minority Ratio is the percentage of employees at your organization that belong to a minority group.
Metrics and time
There can be multiple ways to interpret and calculate business concerns. It is important to understand when data is captured and how time is used when choosing between similar metrics. When looking at metrics and time, you can categorize metrics as a Point-in-time or Over-time metric.
Point-in-time
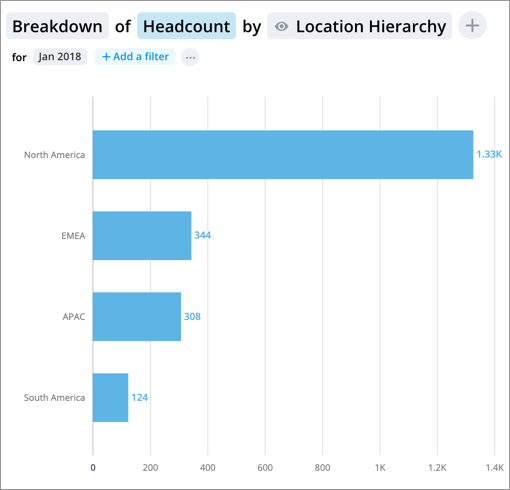
Point-in-time metrics represent data at one specific point in time. Headcount is an example of a point-in-time metric, as it represents the total number of employees on a certain day. If a period is selected (for example, January 2018), the last day of the period (for example, January 31st, 2018) will be used.
Point-in-time metrics are not additive over time, meaning that the metric values for multiple time periods should not be added together. For example, adding the headcount for January 30th with the headcount for January 31st does not make sense. The following screenshot shows a Breakdown chart of Headcount in January 2018. The values in the chart represent the data on the last day of the selected period (January 31st in this case).
Over-time
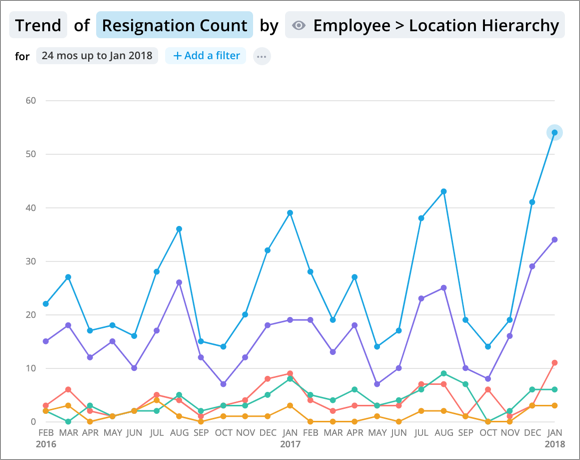
Over-time metrics represent a collection of values that occur over a time range. Usually these metrics are counting events that happened in a specific period (for example, a month). Resignation count is an example of an over-time metric, as it represents the total number of employee resignations in a specific period.
Over-time metrics are additive over time, meaning that the metric values for multiple time periods can be added together. For example, the Resignation Count in January 2018 can be added to the Resignation Count in February 2018 for a total Resignation Count for both months. Use the trailing time calculation to add the metric values for multiple periods together. For more information, see Change trailing time.
The chart below shows a Trend chart of Resignation Count with a 24 month timeline and a December 2018 end point.
The data within each time period (month, in this case) represent the resignations during that period.
In this section