
What Vee Can Do
Learn how to use Vee to explore your data and get insights.
Overview
Vee transforms your workforce questions into data-driven answers. Ask Vee any question about your workforce and it will provide an answer based on your organization’s people data. Use the sections below to learn about Vee's capabilities, the visualizations it supports, and its current limitations.
Prerequisites
Vee's functionality varies based on your organization’s specific configuration. Before asking Vee a question, ensure you've identified which Vee experience you have. For more information, see Determine your Vee experience.
If you have Vee 2.0, you can toggle between experiences in your user preferences:
- On the navigation bar, click your User icon
 > Preferences
  > Vee.
 - In the Vee settings section, use the Vee 2.0 toggle.
What Vee can do
Vee can:
- Pinpoint potential reasons for fluctuations in metrics, whether they are on the rise or decline.
- Examine aggregate data or provide detailed profiles of individual employees.
- Combine multiple metrics to help you grasp relationships and correlations.
- Suggest additional questions or alternative ways to analyze the data you've requested.
- Demonstrate contextual awareness, allowing you to use multiple questions and delve deeper into a single inquiry. It can handle spelling errors and most language nuances effectively.
- Create a report from a list response. Not available in Vee 2.0. For more information, see Create a report with Vee.
- Vee 2.0Answer questions about your data definitions, providing clear definitions for metrics, dimensions, and organizational concepts.
- Vee 2.0Handle complex, multi-layered questions by breaking them down into logical steps, providing transparent reasoning for its findings, and adjusting its analysis based on the data it discovers.
- Vee 2.0Clarify ambiguous terms in your question by asking you to choose between similar members directly in the chat before it provides a response.
- Vee 2.0Provide citations with each insight that reference the underlying data source.
- Vee 2.0Answer questions about your workforce plans, making it easy to compare plan values to your actual data.
- Vee 2.0Personalize your experience by remembering past clarifications, making future conversations seamless without you needing to repeat yourself. For more information, see Create memories from conversations.
When chatting with Vee in the Explore room or full screen, Vee can:
- Update the visual in real time with follow-up questions to gain deeper insights. Common follow-up questions include changing filters and group by's, changing the time context, and adding a comparison metric.
- Filter by high performer (filter)
- Grouped by age (group by)
- Show in Q2 2022 (time)
- Compared with exit rate (compare)
- Filtered by high performer, grouped by age, in Q2 2022 (combination)
- Vee 2.0Explain a visual. These summaries are interactive, allowing you to ask follow-up questions to dig deeper. For more information, see Explain a visual or analysis.
Vee in Explore and full screen uses the displayed visual as context for its responses. For general questions unrelated to a specific visual, use the Vee room.
When chatting with Vee while viewing an analysis, Vee can:
- Vee 2.0Explain an analysis. These summaries are interactive, allowing you to ask follow-up questions to dig deeper. For more information, see Explain a visual or analysis.
- Vee 2.0Answer questions about any visuals in the analysis you are currently viewing by using all visuals and text displayed on your screen as context. Vee supports all visual types as context except Detailed Table, Detailed View, Pipeline Diversity, Text, and Comparison.
Create memories from conversations
Vee 2.0When you clarify a term or explicitly define a term during a chat (such as explaining an organization-specific acronym), Vee remembers that clarification for future conversations. With this personalized memory, you don't need to remind Vee of your specific preferences every time you start a new chat.
Vee will remember:
- Semantic memory: Focused on domain knowledge instead of facts and data. For example, if you tell Vee that OTE stands for On-Target Earnings or that David means David Jones.
- Clarification selections: If Vee needs clarification on an ambiguous term in your question, it will ask you to select the members you intended directly in the chat. For example, if Vee asked you to clarify SWE in the question How many SWEs do we have? and you selected Software Engineer 1 and Software Engineer 2. For more information, see Step 2 in Ask Vee 2.0.
Conversation memories are strictly tied to your user so Vee gets to know your specific terms and preferences over time. For administrators, conversation memory is not available when previewing a project or when previewing the solution as a user to maintain user security. Memories will be deleted if you do not have a conversation with Vee for 90 days.
You can toggle conversation memory in your user preferences:
- On the navigation bar, click your User icon > Preferences > Vee.
- In the Vee settings section, use the Create memories from conversations toggle.
Explain a visual or analysis
Vee 2.0 Vee can provide a narrative summary of a visual or analysis, helping you quickly interpret trends and key takeaways. You can generate an explanation when viewing a visual in Explore or full screen, or when viewing an analysis. When you click the Vee icon, Vee identifies the content on your screen and provides one of two options:
- Explain this visual: Appears when you are viewing a visual.
- Explain this analysis: Appears when you are viewing an analysis.
After Vee generates an explanation, you can use the chat to ask follow-up questions. This allows you to dig deeper into a specific trend or request more detail on a data point.
As an analysis author, you also have the option to select the source content that Vee uses to explain an analysis. For more information, see Optimize an Analysis for Vee.
Note:
- If you don't want users to ask follow-up questions, you can turn off the chat by assigning users the Vee 2.0 capability with the Vee Boards capability instead of the Vee Core capability.
- If you’ve configured personalized alerts in the Home room, click any active alert to investigate the metric in Explore. From there, you can generate an explanation of the visual from Vee.
- In an analysis, Vee supports AI explanations for all visual types except Detailed Table, Detailed View, Pipeline Diversity, Text, and Comparison. For these visuals, you can enter full screen to get an explanation of the visual.
LLM-generated responses
Note:
- This feature uses large language models (LLM) hosted in Microsoft Azure to send organizational data and chat history and return LLM-generated responses (narratives and charts). Customer data is not used for training purposes and no prompt submissions are retained. If you're interested, please contact your Customer/Partner Success Manager.
- LLM-generated responses is an optional feature that can be enabled in Vee. If you have Vee 2.0, this is included by default.
Vee's responses (narratives and charts) are based on your organization’s people data. By default, these responses are generated from a combination of fixed templates and a complex set of rules that analyze the charts Vee creates.
Optionally, Vee can generate responses using a large language model (LLM). With LLM-generated responses, Vee partners with LLMs to help generate a narrative based on your organizational data and chat history. The responses will be more conversational and tailored specifically to the insights in your data. The LLM can highlight key trends, anomalies, and relationships in a more natural, engaging way. The generated responses can provide new ways of explaining the data, providing a fresher perspective with each analysis. For more information, see Step 9 in Ask Vee a question.
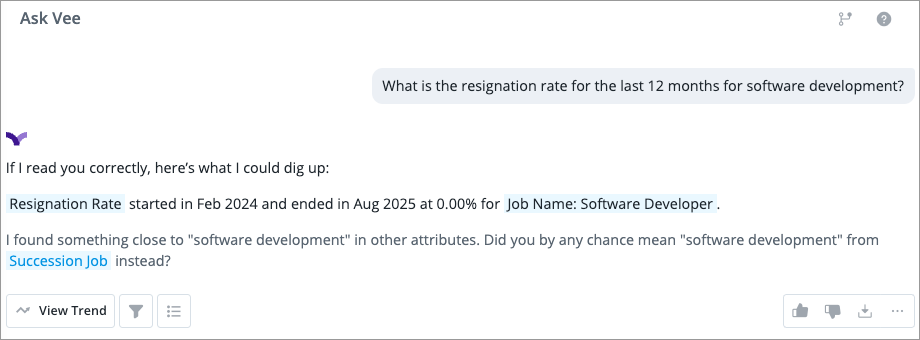
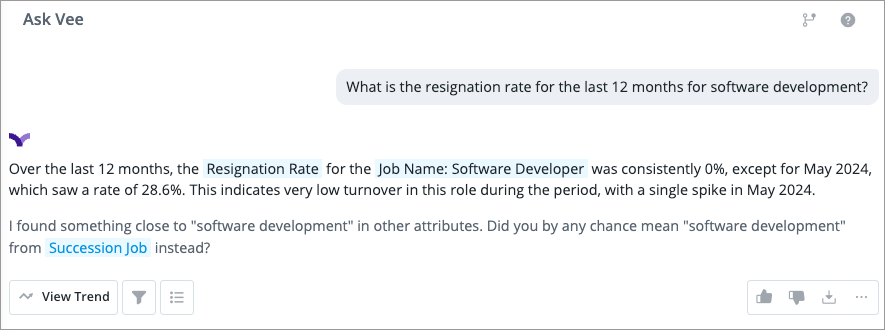
To see the difference, let's look at how Vee answers the same question with these two different options. The first example shows the default response, while the second shows an LLM-generated response.
Default response
LLM-generated response
Supported visualizations
The following table lists the visualizations that Vee can generate in a response, along with example questions that will generate each specific visualization. Visualizations not listed are currently unsupported.
|
Visual type |
Example question |
|---|---|
|
Breakdown |
What is the headcount by location for May 2024? |
|
Trend |
What is the resignation rate trend for the last 12 months? |
|
Table |
Show me the turnover rate by location and department in a table |
|
Bubble Grid |
What is the resignation rate by location and job function? Note: When grouping by two dimensions, Vee will return the Bubble Grid visual only. |
|
Movement Breakdown |
What was the employee movement for the last month? |
|
Quadrant |
What is the correlation between employee exits and starts by organization this year? |
|
Sourcing Paths |
What is the sourcing path for a maintenance engineer? |
|
Career Paths |
What is a possible career path for Olivia Ruiz? |
|
Drivers |
What are the drivers of the resignation rate? |
|
Detailed View |
List of my direct reports |
|
Metric Value |
What is the total headcount? |
|
History |
Who is Augustine Samir Stout? |
Limitations
- If a question cannot be answered from your organization’s people data, you will need to load that data before Vee can answer your question.
- If a question is asked that has no clear relationship to what Visier could answer, we rely on the large language model to provide the translation. That translation may not always be accurate but will still return a reasonable result.
Example:
If you ask the question: How many managers do I have in each department? and your organization does not have a dimension called Department, the closest match will be used. In this example, the closest match is Organization Hierarchy or Cost Center Hierarchy so you may receive a response that uses the Manager Count metric or Manager Ratio metric grouped by Organization Hierarchy or Cost Center Hierarchy. If the answer is not what you expected, you can ask Vee to use another metric or dimension or tune Vee to reply with the dimension you were intending for. For more information, see Prompt Tuning Vee.
- While key groups are supported in Vee, groups are not supported due to potential naming conflicts with other objects. For more information, see Groups and Key Groups.
- If a default context is set, Vee will automatically include it in its responses.
- Vee 2.0 is only available in English - United States (en).