
Create a Movement Concept
Learn how to create, configure, and customize a movement concept.
Access requirements
Profiles: Basic Model Developer
Custom profile with these capabilities: Model (Write, Simple)
Reach out to your administrator for access.
Overview
When building or modifying a movement concept, you must first customize the movement measures. Measures are the metrics you can use to calculate movement with the concept. After you set up the measures, you can then configure the concept by selecting which dimensions belong to each movement type.
For a tutorial that walks you through creating a new concept, see Create New Employee Attributes and Metrics.
Create a movement concept
- Do one of the following:
In a project, on the navigation bar, click Model > Concepts.
In a project, on the navigation bar, click Model > Analytic Objects.
Select an object.
In Attributes, click Create Attribute > Concept.
- Select Movement, and then click Next.
- Select an analytic object, and then click Next.
-
Type a display name and description.
- Click Create.
Customize a movement concept
For an analysis unique to your organization, customize your movement concept by modifying or adding ways to measure movement through metrics and formulas.
Change existing measures
By default, the Count measure exists in all movement concepts. You are able to modify any existing movement metrics to answer your unique business concerns.
Example: In Employee Movement concept, the measures are Headcount, FTE, and Budgeted Direct Compensation. This means that you can calculate employee movement in your organization by the number of employees that moved, the full-time equivalents amount that moved, or the budgeted cost of employees that moved.
-
In a project, on the navigation bar, click Model > Concepts.
- Select a movement concept.
-
Navigate to Customize.
- Under Measures, select a measure such as Count.
- Select a movement metric to open the Info panel.
- In the Info panel under Settings, do one of the following:
- If the measure uses a linked metric, click Edit, select a new metric, and click Link.
- If the measure uses a formula, click Edit, write a new formula, and click Validate.
- Change between a formula and a linked metric by clicking the Use Formula or Link Metric buttons.
Add a new measure
Create additional measures to analyze your movement concept, such as rates or ratios.
-
In a project, on the navigation bar, click Model > Concepts.
- Select a movement concept.
-
Navigate to Customize.
- In Measures, click Add.
-
Type a display name and description.
- Click Create.
- Select one of the automatically-generated metrics.
- In the Info panel under Settings, do one of the following:
- To link a metric, click Link Metric>Link metric, and select a metric to associate with the movement metric.
- To use a formula, click Use Formula>Edit, and write a new formula for the movement metric.
Tip: If your new measure is not a count, be sure to change the aggregation from count in the default formula.
Override the default internal movement formula
The internal movement formula is used throughout internal movement metrics such as Moves in/out/within and Others in/out.
Override the formula to change these metrics as needed. This is useful when your concept doesn't align with the default calculation and authoring a custom formula will advance your analysis objectives. You can also override the default formula to hide a metric so it doesn't display in the solution experience.
Example: In Employee Movement concept, you want to hide the Internal Movement - Others Out of Context metric. Because it inherits a formula, you have to override the parent formula. After overriding, you can then turn off Visible in Analytics.
-
In a project, on the navigation bar, click Model > Concepts.
- Select a movement concept.
-
Navigate to Customize.
- Click on an internal movement metric to open the Info panel.
- Enable the Override Parent Formula toggle to replace the default formula with a new formula or linked metric.
By default, the toggle is off. This means that all internal movement child metrics inherit the default formula.
The default internal movement formula
Internal movement has a default formula that specifies how internal movement is counted on the selected analytic object. The resulting child metrics, such as Moves in/out/within, inherit the default formula.
The default formula is:
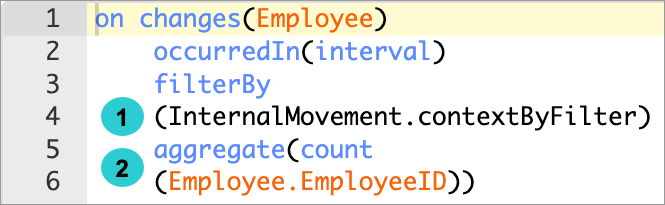
- InternalMovement.contextByFilter: This becomes the specific types of internal movement for each of the five instances (Moves in/out/within, Others in/out).
- count (Employee.EmployeeID): This specifies that movement is counting changes to the selected subject by individual subject IDs.
In the formula, replace "Employee" with the selected subject.
Configure a movement concept
Select members to track population movement, such as moves in, out, and within an organization.
To modify a movement concept, select the dimensions which will track moves in, out, and within your selected population. If no dimension is configured, all movements will be counted in "Others in/out". You can also change the chart labels that will appear on movement visualizations in your solution.
To configure a movement concept:
-
In a project, on the navigation bar, click Model > Concepts.
- Select a movement concept.
- In the Configure tab, expand one of Moves in/out dimensions, Moves within dimensions, or Chart labels.
- In Moves in/out dimensions or Moves within dimensions, select dimensions from the list.
- Optional: In Chart labels, change the default chart labels to a user-defined label.
The following screenshot shows an example of the configuration area for a movement concept.
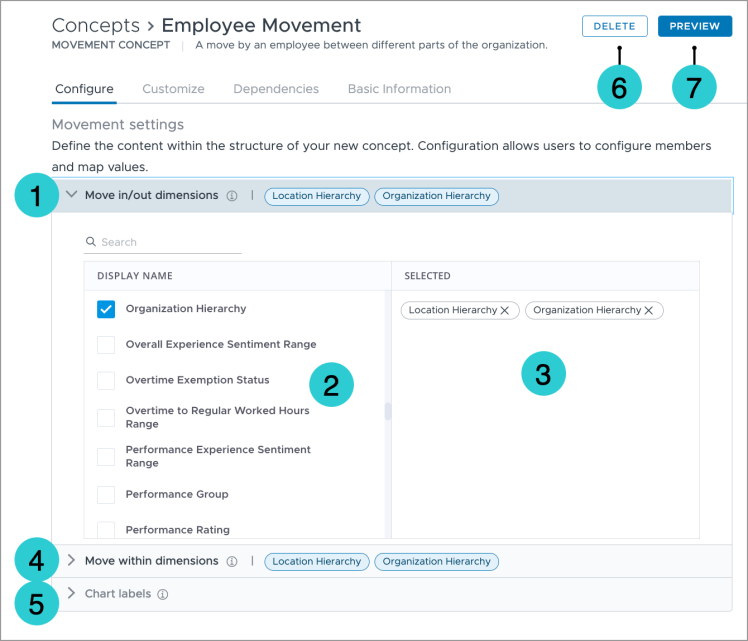
- Move in/out dimensions: The dimensions to calculate moves into or out of. In this example, Employee Movement is calculating move into or out of Organization Hierarchy and Location Hierarchy. This means that, for example, if an employee moves from Canada to Australia, that movement will be counted as a move out of Canada and a move into Australia. For more information, see Defining populations.
- Dimensions: The dimensions available to use in the movement concept. This list is generated from the concept's subject, as shown in the Customize tab.
Note: To modify the dimensions in the movement concept, contact Visier Technical Support.
- Selected dimensions: The selected dimensions. These are the members that will be used to calculate movement in the organization.
- Move within dimensions: The dimensions to calculate moves within those dimensions. In this example, Employee Movement is calculating move into or out of Organization Hierarchy and Location Hierarchy. This means that, for example, if an employee moves from New York to California, that movement will be counted as a move within USA. For more information, see Defining populations.
- Chart labels: The labels that appear on movement visuals for this concept. For more information, see Chart labels.
- Delete: A button to delete the concept.
- Preview: A button to preview the concept in the solution.
Defining populations
Any movement concept configuration impacts the population members included in movement visuals. The solution finds and selects members with changes to the dimensions selected in configuration as well as any filters added to movement visuals during ad hoc analysis. The following visualization identifies the populations of movement concepts: overall and analysis.
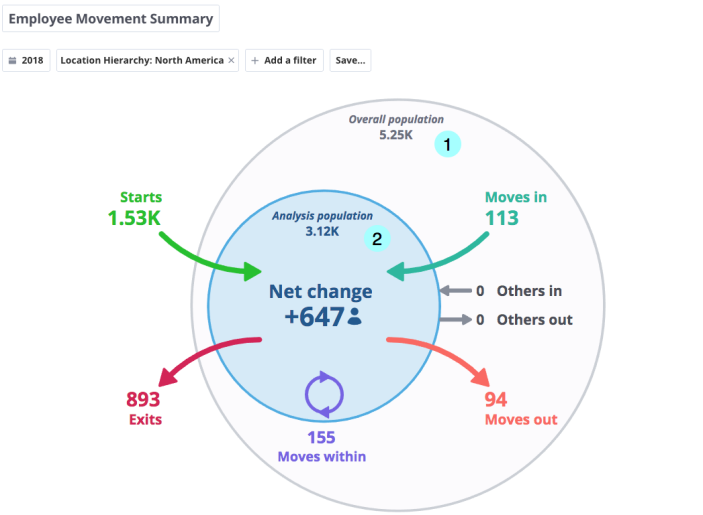
- Overall population: This is the entire set of members defined within the movement concept. For example, total headcount is defined by the concept as the overall population.
- Analysis population: This is the subset of the overall population defined by the filter context. For example, the filter context identifies the Sales team as the analysis population.
Example: Calculation movement on the Employee subject with the Organization dimension configured.
Let's say you're looking at movement for 2018Q3 with the following filters applied:
- Organization: R&D
- Location: Canada
Since Organization is the dimension configured to define the analysis population, the filter value Organization: R&D and Location: Canada defines the middle circle in the movement visual. The overall population is defined by the time context. In this example, 2018Q3 is the selected time context and the secondary dimension is Location: Canada. The table below shows employees in the analysis population with property value changes found in 2018Q3.
| Employee | Organization | Location | Movement type |
|---|---|---|---|
| A | HR to R&D | Canada | Moves in |
| B | R&D | USA to Canada | Others in |
From the analysis context, there were two moves in the analysis population.
- Employee A is counted as "Moves in" because their property value change was to Organization, the main configured dimension.
- Employee B is counted as "Others in" because they moved into the analysis context as a result of changes to their location, the secondary dimension for the selected population.
Chart labels
Chart labels are the labels that appear on movement visuals for this concept, as shown in the following illustration.
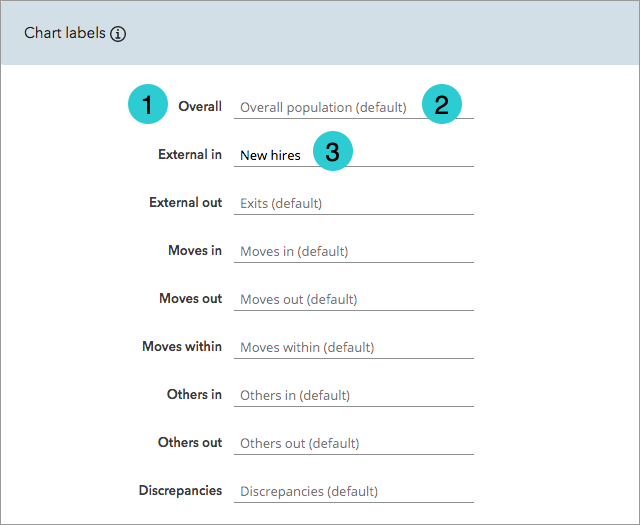
- Movement type: The generated components for the movement concept.
- Default name: Pre-built default display names that appear in movement visuals.
- Custom name: User-defined display names that replace default names in movement visuals.
Discrepancies
Configuring movement is a balancing act to ensure that there isn't overlap or gaps that could result in double-counting or missing numbers. Avoid discrepancies in your movement visuals by practicing consistency across the states being queried, such as the current state or the state in the context of your analysis.
Exits as of last day worked
Exits as of last day worked is a metric that only generates when the movement concept's subject is Employee. Visier calculates exits in a standardized way that may differ from some HR Information Systems (HRIS). Exits as of last day worked allows users to see "External out" movement calculated in a way that is consistent with their HRIS. This movement metric does not have a default formula and must be configured to view it in movement visuals.
Employee exit calculation logic
Exits, whether voluntary or involuntary, are counted as the first day not worked. For example, if an employee's last day of work was September 30, 2018 and the selected period was July 1, 2018 to September 30, 2018, they would not be counted in the Employee Exit Count metric because their exit is counted as the day after their last day worked.
When counting the first day an employee is not working at the firm (that is, the day after their last day) as the exit day, there is never overlap between an employee's last day of work and their exit. This means we can reconcile all movement to zero over a given timeframe.
In financial terms, given that an employee is still technically paid for their last day working at the firm, there is precision in counting their first day not working at the firm as the day they have officially exited the firm, and thus be part of the exit count.
This method of counting exits would also explicitly match the correct answer were an organization to have its contractual employment relationships audited. With this calculation method, you can determine who is working on a selected date and therefore who is being paid. With other exit count calculation methods, such as one which counts an exit as the last day worked, it can be unclear what the total headcount is on any given day because exits are counted as an employee's last day of work.
Here is an example of the effectiveness of this method of counting exits:
An organization with 100 employees has 5 employees with a last day of work on September 30, 2018.
An organization who counts an exit as the last day worked would have a headcount of 100 employees and 5 exited employees on September 30, 2018, for an expected total headcount of 105, but this is not true. The 5 exiting employees are included in the 100 employees, effectively representing 5 employees as "employed" and "exited" simultaneously. Further, the headcount on October 1, 2018 will be 95, a loss of 10 despite having no exit events on October 1.
With Visier's exit count metric, these employee exits are counted on October 1, 2018. The headcount on September 30, 2018 is 100 because there are still 100 active employees. On October 1, 2018 the headcount is 95 because 5 employees had exit events and are no longer with the organization. By separating the last day worked from the exit count, you are able to reconcile all movement to zero and pass an employment audit.
Validate a concept
Access requirements
Profiles: Basic Model Developer
Custom profile with these capabilities: Model (Read, Simple)
Data required: Access to data you're validating
Reach out to your administrator for access.
Previewing your concept allows you to quickly look at your concept as a visual to determine whether its components are configured correctly. To preview your new concept, its associated analytic object must have a default metric. For more information, see Default metric.
-
In a project, on the navigation bar, click Model > Concepts.
-
Select a concept.
- In the upper-right corner, click Preview.
Note: The visual won't display if the concept was configured incorrectly.