
Create New Employee Attributes and Metrics
Learn how to add new attributes and metrics to your analytic model in Visier to enhance your analysis options.
Introduction
If you have additional use cases beyond the out-of-the-box content in Visier, you can create new objects in the analytic model to accomplish your organization's goals.
You might want to enhance your analytic model in Visier in the following scenarios:
- You're a new Visier customer and just loaded your data into the application. After connecting your data to Visier's existing objects, you note that there's a few unique attributes in your data that you want to load into Visier. To get that data into Visier, you'll need to create new objects in Visier.
- You want to bring HR-adjacent datasets into Visier to enrich your people data and build focused people insights that aren't in Visier's out-of-the-box content. For example, let's say you work in the manufacturing industry and want to bring production data into Visier so that you can analyze the impact of production and employee data on each other. To use that data in Visier, you'll need to create production objects in Visier to link your data to.
- The reports you share with your leadership team use a metric that isn't covered by Visier's existing content, and you want to add that metric to Visier.
For more information about the analytic model, see Understand Visier's Analytic Model.
In this tutorial, you will learn how to create a new property, dimension, concept, and metric to analyze the average age at which part-time employees join your organization.
Objectives
In this tutorial, we'll walk you through the decision-making process to determine which objects already exist in Visier and which you must create to answer a specific business question. We will then take you through how to create the required objects. By the end of this tutorial, you will be able to use the new objects you created in analyses and visualizations.
In our example, we will enhance the analytic model using already-loaded employee data in a new calculated property, range dimension, selection concept, and metric.
You will learn how to:
- Identify the required objects to answer your business question
- Investigate what objects already exist in the analytic model, and which objects need to be created
- Create new properties, dimensions, concepts, and metrics
- Preview your newly created objects in the solution experience
Prerequisites
Before beginning this tutorial, you will need:
- A Visier account that has the following profiles. If you don't have an account, contact your administrator.
Data Engineer
- Basic Model Developer or Advanced Model Developer
-
A Visier account with a permission that allows the user to access guidebooks, analyses, the Explore room, and data access to view the data you're using in the solution experience. For more information, see Data and Content Security.
- Ad Hoc Analysis
- Create Analysis Context
- Change Analysis Context
- Guidebook
- View Details
- Loaded data and a data version. For more information, see Bring Data In and Data Versions.
Sample data
Caution: We don't recommend using the sample data in production environments where data is already loaded.
This tutorial begins where the Configure Concepts After Loading New Data tutorial left off. If you want to follow along with this tutorial, we recommend that you Download the employee sample data files and complete the previous tutorial.
Steps
Decide what to create
Let's say your business question is to understand the average age at which part-time employees start working at your organization. Now that we have a business question, we need to figure out what objects in Visier can answer that question. First, let's form a metric formula because metrics are calculations that answer business questions. To write the metric formula, we need to answer the following questions:
- What subject is the metric calculating? Because we're interested in part-time employees, the subject is Employee.
- What subject members are included in the calculation? Because we're interested in part-time employees, the subject members are current employees who are part-time. In Visier, you can select certain groups of subject members using selection concepts. To select active part-time employees, we need two selection concepts: Current Employee and Part-Time Employees.
- What kind of calculation is it? We want to know the average age of part-time employees when they started working at the organization, which means we're calculating (aggregating) an average. In the Visier Formula Language, we will use the functions aggregate and average.
- What information about the subject members is it calculating? We want to know what age the part-time employees were at the time they started working for the organization. To calculate that, we need a property on Employee that calculates Age at Start Date.
Tip:
- Not sure what subjects and subject members are? Check out Understand Visier's Analytic Model.
- Not sure whether to create a property, dimension, or concept? Learn more about these object types:
- For more information about writing metric formulas, see Work With Metrics.
With the above information, we can write the following formula:
on Employee filterBy(Current Employee && Part-Time Employees) aggregate average(Age at Start Date)
From the formula, we know that we need the following objects:
- Employee (subject)
- Current Employee (selection concept)
- Part-Time Employees (selection concept)
- Age at Start Date (calculated property)
Next, we have to find out if any of those objects already exist in Visier, and which objects don't exist yet.
Tip: If you can't find the objects you're looking for, try using different search terms. For example, if you can't find Current Employee, try searching "Active Employee", "Current Staff", "Active Staff", or any other similar terms.
- In Visier, in Studio, open a project and navigate to Model > Analytic Objects.
- Search for Employee. In this tutorial, Employee already exists in the analytic model.
- Select Employee.
- In Employee, in the Attributes tab, search for Current Employee. In this tutorial, Current Employee already exists in the analytic model.
- In Employee, in the Attributes tab, search for Part-Time Employees. In this tutorial, we're going to pretend Part Time Employees doesn't exist in the analytic model so that we can practice creating concepts.
- In Employee, in the Attributes tab, search for Age at Start Date. In this tutorial, Age at Start Date doesn't exist in the analytic model. We will create it as a calculated property later in the tutorial.
Now that we know which objects exist and which objects we have to create, we can start creating new objects in Visier.
Optional: Load additional data
In this tutorial, you don't need to load additional data. However, you may want to enhance Visier's analytic model to answer business questions with data that isn't yet in Visier. To add new data, you might need to first create new analytic objects or attributes in Visier. You can load the new data and then connect that data to the new objects you created. For more information about loading data, see Bring Data In.
Create objects
In the previous section, we figured out that we're missing a calculated property and selection concept. To answer our business question (the average age that part-time employees started at the organization), we can also create a range dimension to group part-time employees into age groups, which will help us analyze the data. In this section, we will walk through the steps to create a selection concept and a calculated property, and then, using those objects, create the metric Average Part-Time Employee Start Date Age. We will additionally create a range dimension to group employees by their age when they started at the organization.
Introducing the visual title and analysis context
As part of object creation, we will go through validation steps to confirm that the data is correct by comparing it against the source data. This will involve interacting with visualizations to change the data that is displayed.
Use the various elements to analyze your data and build a visual to suit your needs.
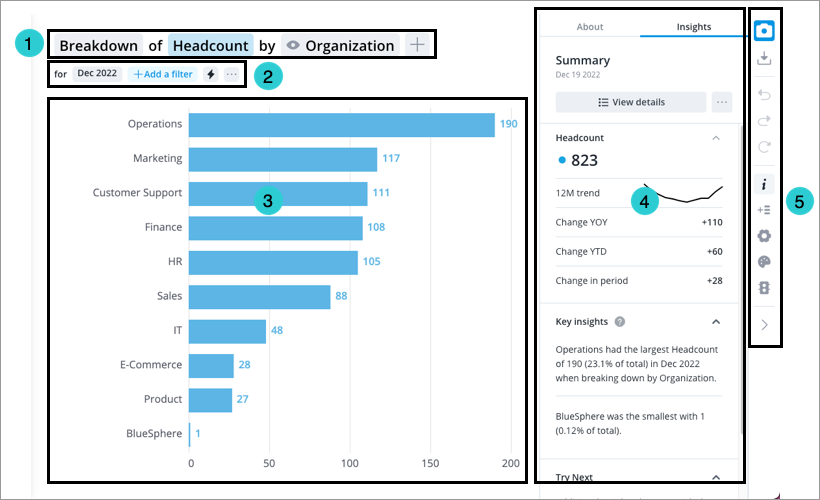
- Visual title: Describes and controls the data that is displayed in the chart. Click the Metric picker, Visual picker, and Group By picker in the visual title to change the data that is displayed. For more information, see The Visual Title.
- Analysis Context toolbar: Change the Analysis Context to select the population and time period for analysis. For more information, see The Analysis Context.
- Chart: Graphical representation of one or more metric.
- Side panel: View contextual information about selected metrics and data points, customize the appearance of your chart, and change chart configurations.
- Visual Actions menu: Use these quick access buttons to perform chart actions and open chart customization and configuration options in the Side panel. For more information, see Visual Actions Menu.
Create a selection concept
In the first step, we figured out that we need a selection concept on the Employee subject that selects part-time employees. We will name this selection concept Part-Time Employees (Tutorial).
Note: Your analytic model might already have a selection concept called Part Time Employees, however, in this tutorial we want to practice creating a selection concept, so we're going to create Part-Time Employees (Tutorial) from scratch.
To determine whether or not an employee is part-time, we need to know the employee's employment type. To determine employment type, we must have employment data loaded in Visier.
Before we create the concept, let's investigate whether we have employment data in Visier.
- In your project, on the navigation bar, click Data > Mappings.
- Search for and select Employee Mapping.
- In Employee Mapping, in the Configure tab, search for Employment. We want to find employment-related mappings to confirm whether we have employment data in Visier and whether it's already mapped to objects in Visier. In this tutorial, the Employment_Type mapping exists.
- Expand the Employment_Type mapping. It should be a Map from column mapping from your data source's column for employment type data to Visier's Employment_Type dimension. If Employment_Type is unmapped, map it now and run a new data version. For more information, see Add a Mapping and Run a Job.
Now that we've confirmed that our employment type data is loaded and mapped to a dimension in Visier, we can create the selection concept.
- In your project, on the navigation bar, click Model > Analytic Objects.
- Search for and select Employee.
- In Employee, in the Attributes tab, click Create Attribute > Concept.
- In Concept type, select Selection.
- In Selection concept type, select Member.
- Click Next.
- In Select analytic object, click Next. Employee is already selected.
- In Basic Information, type the following:
- In Display name, type Part-Time Employees (Tutorial).
- Optional: In Description, type a description for the concept. In this tutorial, we'll type An employee with an employment type of "part-time", but you can write any description you want.
- Click Create.
Next, we'll configure the new selection concept to ensure it selects the correct employees.
- In Part-Time Employees (Tutorial), in the Customize tab, click Add Dimensions.
- Search for and select Employment Type, and then click Add.
The data from our source that maps to the Employment Type dimension is used in this selection concept.
- Navigate to Configure.
- In Employment Type, select the members Part-Time Regular and Part-Time Shifts On Call.
Any employee whose employment time is Part-Time Regular or Part-Time Shifts On Call are selected by this concept.
- Navigate to Basic Information.
- In Object name, replace the default object name with isPartTimeEmployeeTutorial.
- Optional: In Part-Time Employees (Tutorial), click Preview. In the preview, confirm that the number of part-time employees looks correct.
Next, let's create the calculated property.
Create a calculated property
We need a calculated property on the Employee subject that calculates the employee's age when they first started working at the organization. We will name this property Age at Start Date.
If we subtract the employee's current age from their tenure (how long they've been with the organization), we will know how old the employee was when they started at the organization.
To calculate an employee's Age at Start Date, we need to know:
- The employee's current age.
- The employee's tenure.
Note: We use the employee's current age and tenure to calculate Age at Start Date instead of date of birth and start date because current age and tenure gives a value in months and therefore allows us to use more functions, such as average or difference. If we used Birth Date and Start Date, the result would be a date, which the Visier Formula Language (VFL) cannot perform arithmetic on. This is why the function monthsBetween() is used in VFL. For more information about the VFL, see Visier Formula Language (VFL).
Before we create the property, let's investigate the analytic model to decide whether we can use any of the existing attributes to make writing the property formula easier.
- In Visier, in Studio, create a project and navigate to Model > Analytic Objects.
- Search for and select Employee.
- In Employee, in the Attributes tab, search for Age. We want to find an age-related property to inform our approach to creating the Age at Start Date property. By searching Age, we will find all attributes with "Age" in the display name. In this tutorial, we'll select Age in Months.
- Select Age in Months. In the Customize tab, make sure the formula is:
monthsBetween(Employee.Birth_Date, effectiveDate, gregorian)
This formula states that it's calculating the number of months between the current effective date in the Gregorian calendar and the employee's birth date. If the formula in your tenant is different, update it now.
- In Age in Months, navigate to Basic Information. Note that the object name is Age_In_Months. When writing formulas in Visier, we use the object names to reference specific objects.
Because there's already a property that calculates an employee's age in months, we can reuse that property in our Age at Start Date property rather than writing another calculation formula. Let's keep looking for more attributes that will help us.
- In your project, return to Model > Analytic Objects > Employee.
- In Employee, in the Attributes tab, search for Tenure. We want to find a tenure-related property to include in our formula for the Age at Start Date property. By searching Tenure, we will find all attributes with "Tenure" in the display name. In this tutorial, we'll select Tenure.
-
Select Tenure. In the Customize tab, make sure the formula is:
monthsBetween(Employee.Start_Date, effectiveDate, gregorian)
This formula states that it's calculating the number of months between the current effective date in the Gregorian calendar and the employee's start date. If the formula in your tenant is different, update it now.
Note: Tenure_Start_Date or Start_Date?
Your tenant might have a default formula of monthsBetween(Employee.Tenure_Start_Date, effectiveDate, gregorian) for Tenure. In this tutorial, we recommend that you replace Tenure_Start_Date with Start_Date because the sample data doesn't have a Tenure_Start_Date column.
- In Tenure, navigate to Basic Information. Note that the object name is Tenure. When writing formulas in Visier, we use the object names to reference specific objects.
Because there's already properties that calculate an employee's age in months and tenure in months, we can use these properties in our Age at Start Date formula.
Next, create the calculated property.
- In your project, return to Model > Analytic Objects > Employee.
- In Employee, in the Attributes tab, click Create Attribute > Property.
- In Property type, select Calculated.
- In Display name, type Age at Start Date.
- In Object name, type Age_at_Start_Date.
- In Data type, select Months.
- Optional: In Description, type a description for the property. In this tutorial, we'll type The age at which an employee started at the organization, but you can write any description you want.
- Optional: In Tags, select Demographics. For more information about tags, see Create and Assign Tags to Content.
- In Formula, type Age_In_Months - Tenure.
This formula states that it's calculating the value from Age in Months minus the value from Tenure. An employee's age in months minus their tenure in months will give us the Age at Start Date in months.
- Click Done.
- Optional: In Age at Start Date, click Preview. In the preview, confirm that the employees' ages at start date look correct. The values should be in months.
Now that we have the objects we were missing, we can move on to creating the metric.
Create a metric
To answer a business question, we can create a metric that calculates specific information. In this example, we want to answer the question of what age our part-time employees are when they started at the organization. We will name this metric Average Part-Time Employee Start Date Age.
To write a metric formula, we must be familiar with the Visier Formula Language and the structure of a metric formula. Each formula must contain:
- An analytic object. This is the object whose data you're calculating. In this example, we're calculating employee data, so the analytic object is Employee.
- A time handling statement. You can omit the time handing statement if you're using the object's default time handling option. In this example, we're using the default time handling for a subject (validUntil instant), so we'll omit time handling from the formula.
- A filter. This is the attributes to use in the calculation. In this example, we're filtering by current employees (isActiveEmployee) and part-time employees (isPartTimeEmployeeTutorial).
- An aggregation function. This is the type of calculation to do and on which property to perform the calculation. In this example, we're performing an average calculation (aggregate average) on the Age at Start Date (Age_at_Start_Date) calculated property.
Tip: If you're unfamiliar with Visier's formula language, you can take a look at metrics in the analytic model to get a sense of how to structure a metric formula. In this tutorial, you could try to find age-based metrics to review their formulas before attempting to write your own.
- In Visier, in Studio, open a project and navigate to Model > Metrics.
- Search for and select Age.
- In Age, in the Formula tab, review the formula box, which contains the following formula: on Employee validUntil instant filterBy(isActiveEmployee) aggregate average(Employee.Age_In_Months / 12).
Metric formulas start with the on function to define the object on which the calculation is performed, so we'll start the formula with on Employee.
Next, we'll use the filterBy function to define the attributes to filter the calculation by. Because we're filtering by two attributes, we'll use the && function to include both attributes in the filter: filterBy(isActiveEmployee && isPartTimeEmployeeTutorial).
After the filter, we can specify how to perform the calculation. The function for aggregations is aggregate followed by the aggregation type. In this example, we'll use the aggregation type average. When a metric is aggregating a specific property, that property follows the aggregation type: aggregate average(Age_at_Start_Date). However, Age at Start Date returns an employee's age in months. For the metric, we'd prefer to know an employee's age in years, since that's easier to understand than doing the mental calculation from months to years. So, let's divide Age at Start Date by 12: aggregate average(Age_at_Start_Date / 12).
All together: on Employee filterBy(isActiveEmployee && isPartTimeEmployeeTutorial) aggregate average(Age_at_Start_Date / 12)
Now that we have the metric formula, we're ready to create the metric in Visier.
- In your project, on the navigation bar, click Model > Metrics.
- Click Create Metric.
- In the Create metric dialog, type the following:
- In Display name, type Average Part-Time Employee Start Date Age.
- Optional: In Description, type a description for the metric. In this tutorial, we'll type The average age of part-time employees when they started at the organization, but you can write any description you want.
- Click Create.
Next, we'll finish setting up the new metric.
- In Average Part-Time Employee Start Date Age, in the Formula tab, type on Employee filterBy(isActiveEmployee && isPartTimeEmployeeTutorial) aggregate average(Age_at_Start_Date / 12) in the formula box.
- Click Validate. The formula should be valid. If you receive an error message, review the message and make any necessary changes to the formula or object names for Current Employee, Part-Time Employees (Tutorial), and Age at Start Date.
- Navigate to Settings and do the following:
- In Data type, select Years.
- In Analytic object, select Employee.
- In Additive type, select Non-additive.
- Skip the other settings.
- Optional: In Average Part-Time Employee Start Date Age, click Preview. In the preview, confirm that the average age of part-time employees at their start date looks correct. The values should be in years.
The metric is ready to use, but before we check it out in a visualization, let's make one more object.
Create a range dimension
To assist with our analysis, we can create a range dimension to group employees by their age when they started at the organization. Range dimensions organize values into range groups. When used in a visualization, the range groups appear on the y-axis to categorize data into defined groups. We'll name the dimension Age at Start Date Range.
- In your project, on the navigation bar, click Model > Analytic Objects.
- Search for and select Employee.
- In Employee, in the Attributes tab, click Create Attribute > Dimension.
- In Dimension type, select Range.
- In Display name, type Age at Start Date Range.
- Optional: In Description, type a description for the dimension. In this tutorial, we'll type The age at which an employee started at the organization expressed as a range, but you can write any description you want.
- Optional: In Tags, select Demographics. For more information about tags, see Create and Assign Tags to Content.
- Click Done.
Next, we'll set up the range groups in the new range dimension.
- In Age at Start Date Range, in the Customize tab, click Select a Property.
- In the Select a property dialog, search for and select Age at Start Date.
- Click Select.
- In Define your ranges, in Range Type, select Manually defined ranges.
- In the box, type the following range boundaries: 0 240 300 360 420 480 540 600 660 720 780.
Note: The range groups are inclusive at the start and exclusive at the end. For example, in the group 240 to 300, 240 is included in the range and 300 is excluded from the range.
Because Age at Start Date is a property calculated in months, the range groups must be month values as well. However, we can configure the range display names to display the year values.
- In Age at Start Date Range, in the Configure tab, hover over the first row in the table.
- In the Display Name column, click the Edit button
 .
. - Replace 0 ~ 240 with 0 to 20 yrs. In a visualization grouped or filtered by Age at Start Date Range, the group's name will display as 0 to 20 yrs instead of 0 ~ 240. Next, replace the remaining range group display names:
- Replace 240 ~ 300 with 20 to 25 yrs.
- Replace 300 ~ 360 with 25 to 30 yrs.
- Replace 360 ~ 420 with 30 to 35 yrs.
- Replace 420 ~ 480 with 35 to 40 yrs.
- Replace 480 ~ 540 with 40 to 45 yrs.
- Replace 540 ~ 600 with 45 to 50 yrs.
- Replace 600 ~ 660 with 50 to 55 yrs.
- Replace 660 ~ 720 with 55 to 60 yrs.
- Replace 720 ~ 780 with 60 to 65 yrs.
- Replace 780 ~ Inf with 65+ yrs.
- Optional: In Age at Start Date Range, click Preview. In the preview, confirm that the correct range groups (20 to 25 yrs, 25 to 30 yrs, etc.) show up on the visualization's y-axis.
Now that the range dimension is set up, we can move on to previewing our work.
Preview objects in the solution
Note: If you open the solution experience and can't access any analyses or the Explore room, you may not have the correct permission capabilities. For more information, see Data and Content Security.
Now that we've created all the necessary objects, we need to confirm that the objects work as expected in the solution. This is done by previewing the objects in the solution in either the Guidebooks room or Explore room.
- The Guidebooks room is where you can view prebuilt analyses to get insights into your business questions. However, guidebooks are prebuilt and won't contain any of the new objects we created in this tutorial. In this tutorial, we'll create a validation analysis to check that our new property, concept, dimension, and metric are working as expected.
- The Explore room is where you can conduct most of your ad hoc analysis in the solution and customize visuals to suit your needs. In this tutorial, we'll use the Explore room to check that our new property, concept, dimension, and metric are working as expected.
Add Age at Start Date to Detailed View
Before we preview the objects, we must first add Age at Start Date to Detailed View because calculated properties are only visible in the solution experience through Detailed View.
- In your project, on the navigation bar, click Model > Analytic Objects.
- Search for and select Employee.
- Navigate to View Details.
- Click Manage Properties.
- Search for and select Age at Start Date, and then click Update.
- Optional: Click Reorder Properties and then drop-and-drop Age at Start Date to a higher position in the list. This changes where the property shows up in Detailed View. In this tutorial, we reordered Age at Start Date to come after Age.
Result: Age at Start Date is now available in Detailed View.
Preview new objects in an analysis
In this section, we'll create a validation analysis to preview our new objects. The advantage of previewing new objects in an analysis is that if an object is incorrect, we can correct the objects and then refresh the analysis, which some users find more convenient. If you'd prefer to preview the objects in Explore, see Preview new objects in Explore.
Create an analysis
Because we created new objects, none of Visier's existing analyses will use any of the objects. To use the objects in an analysis, we’ll have to create an analysis ourselves.
- In your project, on the navigation bar, click Model > Analyses.
- Click Create Analysis.
- In the Create Analysis dialog, do the following:
- In Display Name, type Age at Start Date Part-Time Employees - Validation.
- Optional: In Description, type a description for the analysis. In this tutorial, we'll type Validate the Age at Start Date and Part-Time Employees (Tutorial) objects, but you can write any description you want.
- When finished, click Create.
Next, we can edit the analysis to add visualizations that feature each of our new objects.
- In your project, on the navigation bar, click Model > Analyses.
- Search for and select the Age at Start Date Part-Time Employees - Validation analysis.
- Click Edit Analysis.
- To add the Part-Time Employees (Tutorial) concept, do the following:
- In the Analysis Editor, click the Insert button
 > Chart > Create new chart.
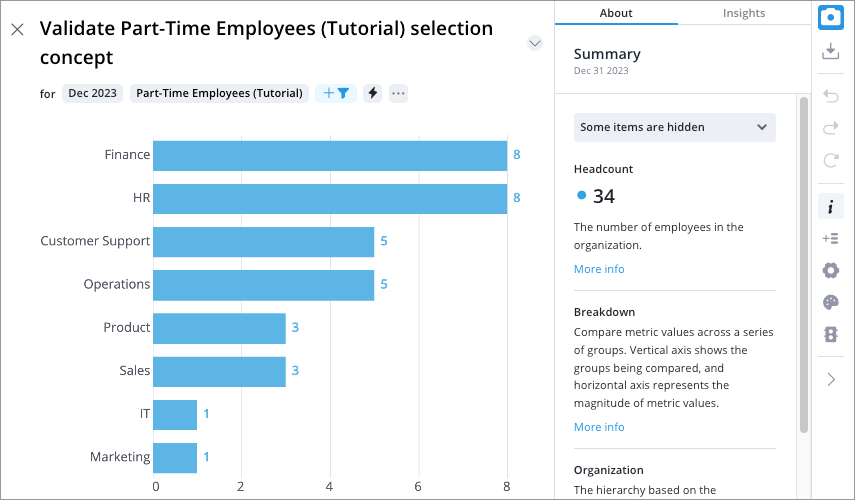
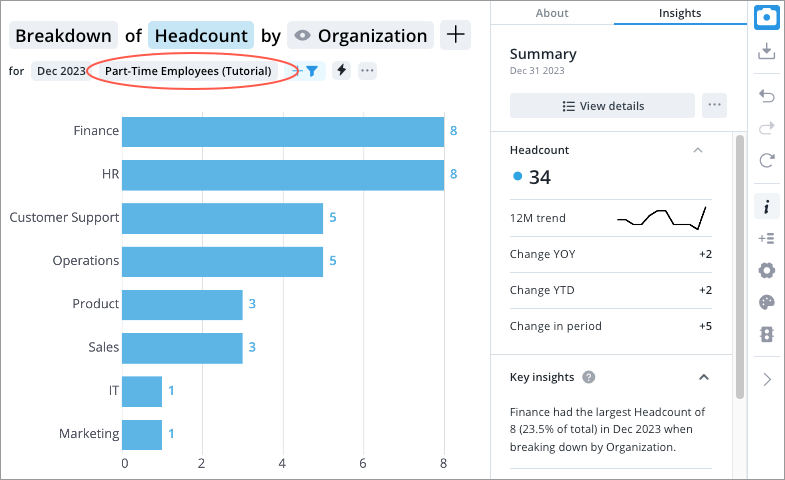
 - In Add a title, type Validate Part-Time Employees (Tutorial) selection concept.
- On the Analysis Context toolbar, click Add a filter.
- Search for and select Part-Time Employees (Tutorial).
- In the Time picker, select December 2023.
- When finished, click Add and Close.
- In the Analysis Editor, click the Insert button
- To add the Age at Start Date property, do the following:
- In the Analysis Editor, click the Insert button > Chart > Create new chart.
- In the Time picker, select December 2023.
- In the Info panel
 , in the Insights panel, click View details.
 - With an employee selected, in the Info panel , click the Capture button
 . To use Detailed View in an analysis, you must first capture it.
 - After capturing, we must return to the Analysis Editor and add a chart again. To close Detailed view, click the Close button
 , then click Cancel in the New Chart dialog, and then click Cancel in the Add to Analysis dialog.
 - In the Analysis Editor, click the Insert button > Chart.
- Under Select a chart from your captures, select the Detailed View capture, and then click Add.
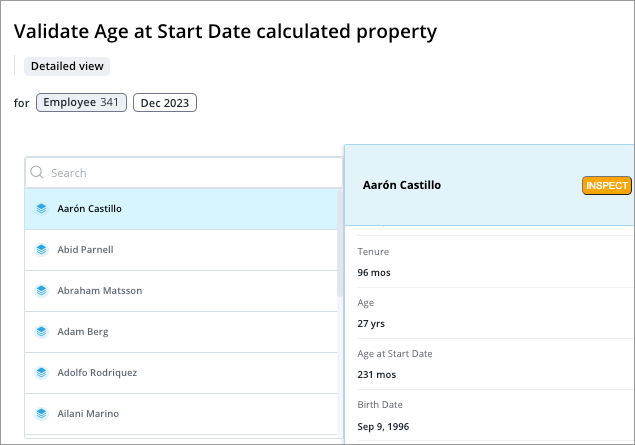
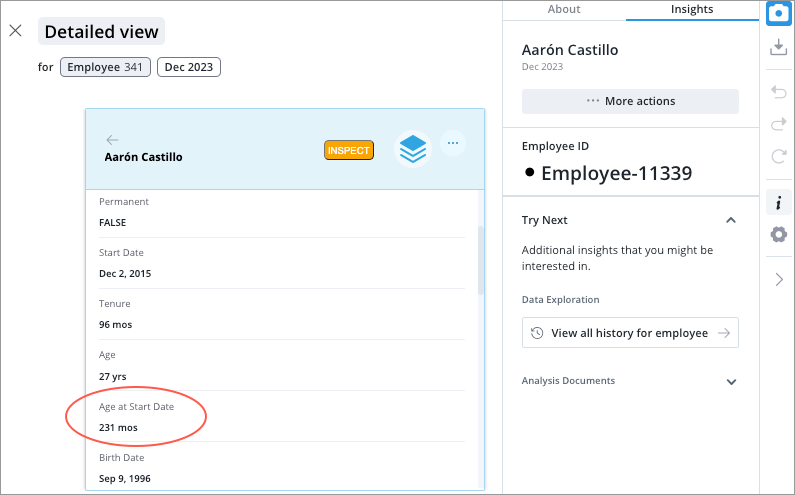
- In the Analysis Editor, click the chart card's title to edit it, and then type Validate Age at Start Date calculated property and click Save.
- In the Analysis Editor, click the Insert button
- To add the Average Part-Time Employee Start Date Age metric, do the following:
- In the Analysis Editor, click the Insert button > Chart > Create new chart.
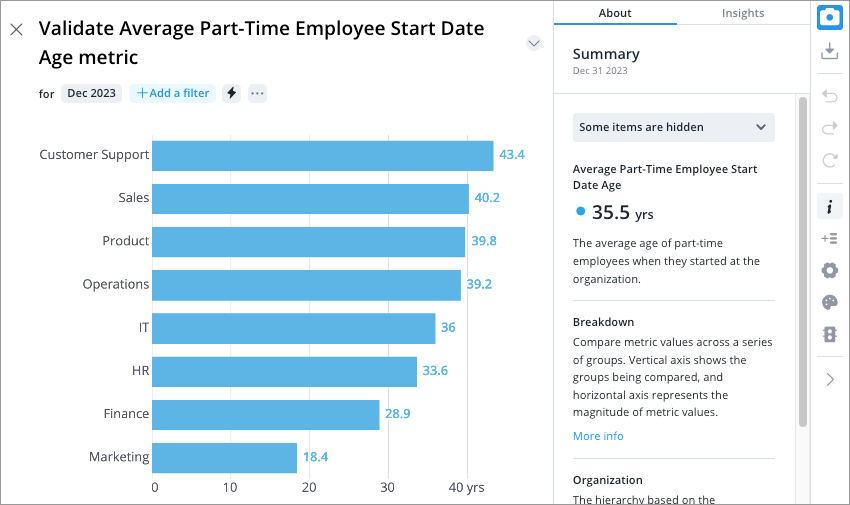
- In Add a title, type Validate Average Part-Time Employee Start Date Age metric.
- On the Visual title, click the Metric picker.
- In the Metric picker, search for and select Average Part-Time Employee Start Date Age.
- In the Time picker, select December 2023.
- When finished, click Add and Close.
- In the Analysis Editor, click the Insert button
- To add the Age at Start Date Range dimension, do the following:
- In the Analysis Editor, click the Insert button > Chart > Create new chart.
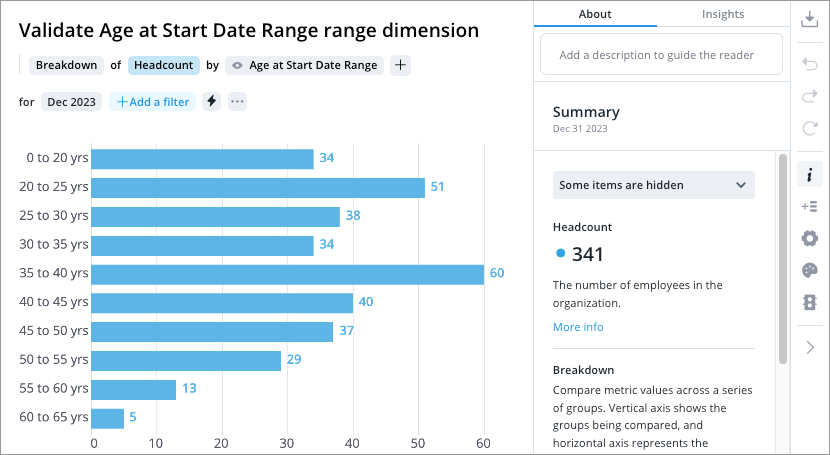
- In Add a title, type Validate Age at Start Date Range range dimension.
- On the Visual title, click the Group by picker.
- In the Group by picker, search for and select Age at Start Date Range.
- In the Time picker, select December 2023.
- When finished, click Add and Close.
- In the Analysis Editor, click the Insert button
- When finished, click Done editing.
Preview the analysis
With the analysis finished, we can preview it in the solution to check that everything's working as expected.
- In your project, on the navigation bar, click Preview Solution.
- In the solution experience, on the navigation bar, click Analyses.
- Select Age at Start Date Part-Time Employees - Validation.
- Review the charts to make sure everything is correct. If using the sample data, you should see the following values:
- In the Validate Part-Time Employees (Tutorial) selection concept visualization, the headcount is 34.
- In the Validate Age at Start Date calculated property visualization, Aarón Castillo's age at start date is 231 months.
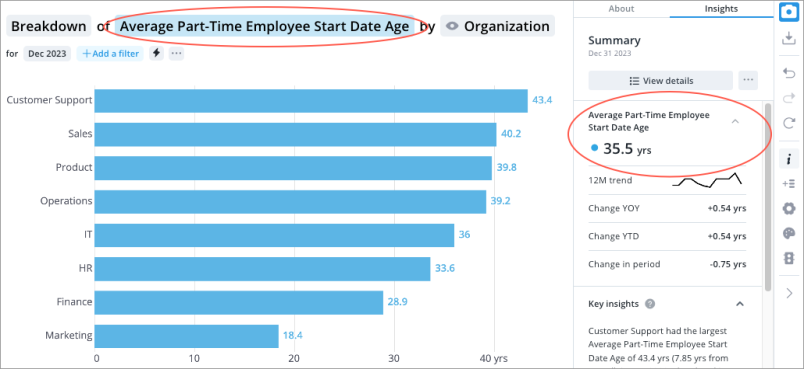
- In the Average Part-Time Employee Start Date Age visualization, the average start date age for part-time employees is 35.5 years.
- In the Validate Age at Start Date Range range dimension visualization, the headcount of employees aged 20 to 25 when they started is 51.
- If an object seems wrong, return to your project and investigate the object. After correcting the object, repeat steps 1-3 to preview the object in the analysis.
Note: If you don't want to publish the analysis you used for validation, remember to delete it before you publish the project.
Preview new objects in Explore
Alternatively, you can use the Explore room to preview objects. If you already validated the objects in an analysis, in Preview new objects in an analysis, you don't have to preview the objects in Explore. The advantage of previewing objects in Explore is that you can quickly adjust the analysis context without the additional work of creating an analysis and setting up charts. This is a good option if you're confident that your objects are correct.
Preview a selection concept
After checking Age at Start Date, we can check the Part-Time Employees (Tutorial) concept. To check the concept, we'll filter a visualization by Part-Time Employees (Tutorial).
- In preview mode of the solution experience, on the navigation bar, click Explore.
- On the Analysis Context toolbar, click Add a filter.
- Search for and select Part-Time Employees (Tutorial).
- In the Time picker, select December 2023.
Result: The visualization shows values for part-time employees.
Preview a calculated property
First, let's check that the Age at Start Date property works. To validate a property, we can open Detailed View and review an employee's Age at Start Date property.
- In the project, on the navigation bar, click Preview Solution.
Result: The solution experience opens in preview mode.
- On the navigation bar, click Explore.
- In the Time picker, select December 2023.
- In the Info panel , in the Insights tab, click View details.
-
Select an employee and then scroll through their attributes until you find Age at Start Date. The value should be in months.
Preview a metric
Finally, we can check the metric we created. To check the metric, we'll change the visualization's metric to Average Part-Time Employee Start Date Age.
- In preview mode of the solution experience, on the navigation bar, click Explore.
- On the Visual title, select the following:
- Visual type: Breakdown
- Metric: Average Part-Time Employee Start Date Age
- Group by: Organization
- On the Analysis Context toolbar, select the following:
- Time period: December 2023
- Filter: None
Result: The visualization now shows the average age that part-time employees started at the company, grouped by each organization.
- In the Info panel , in the Insights tab, review the Average Part-Time Employee Start Date Age value to learn the average age across the entire organization.
Preview a range dimension
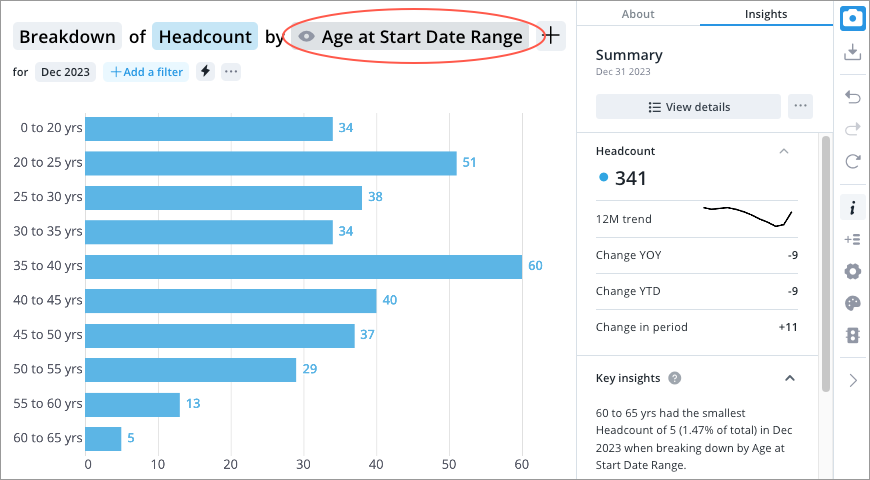
Next, let's check the Age at Start Date Range dimension. To check the range dimension, we'll group a visualization by Age at Start Date Range.
- In preview mode of the solution experience, on the navigation bar, click Explore.
- Remove any filters on the visualization, such as Part-Time Employees (Tutorial).
- On the Visual title, click the Group By picker.
- Search for and select Age at Start Date Range.
-
In the Time picker, select December 2023.
Result: On the visualization's y-axis, Age at Start Date Range now groups data for the visualization. You should see the range group display names you configured earlier, such as 0-20 yrs and 20-25 yrs.
After we verify the new objects are working as expected, we have successfully enhanced the analytic model in Visier.
Next steps
Now you know how to create new attributes and metrics in the Visier solution. This tutorial walked you through how to figure out what objects to create to answer a specific business question, how to create the objects, and how to write a metric formula using those new objects.
At this point, you might choose to publish your project so that the changes are available in production. For more information, see Publish Project Changes. If you choose not to publish, only you and anyone with access to the project can see your changes.
After enhancing your Visier solution, you can start building analyses about the new metric and objects, or continue creating more objects to answer other business questions.