
Configure Concepts After Loading New Data
Learn how to set up the analytic model to give meaning to your new data.
Introduction
After successfully loading data in Visier and generating a data version in the Upload Data Files Using the Solution tutorial, the next step involves configuring concepts. This is an important part of onboarding data into Visier because it gives meaning to your data. Setting up the analytic model through concept configuration allows you to complete specific use cases and accomplish your organization's goals. For more information about the analytic model, see Understand Visier's Analytic Model.
For example, let's say you're a new Visier customer who just loaded your data into the application. To start using Visier, you'll need to configure concepts by defining how your data values align with concepts in Visier so that the platform represents your data appropriately.
In this tutorial, you will learn how to configure a specific set of selection concepts and calculation concepts so that you can analyze employee data, starts and exits data, and organization hierarchy data.
Objectives
First, we'll walk you through the different ways you can figure out what concepts you need to configure. We will then take you through how to configure a specific set of selection concepts and calculation concepts so that you can analyze employee data, starts and exits data, and organization hierarchy data.
By the end of this tutorial, you will harmonize your data into concepts that allows you to view the following out-of-the-box metrics:
- Age
- Average FTEs
- Average Headcount
- Full-Time Equivalents
- Headcount
You will learn how to:
- Find unconfigured concepts in the Data Issues room
- Identify concepts that need to be configured by reviewing the dependencies of properties and dimensions
- Identify concepts that need to be configured by reviewing the dependencies of metrics
- Determine if a concept of interest needs to be configured or additional data is required
- Configure calculated selection concepts, member selection concepts, and calculation concepts
- Preview configured concepts in the solution experience
- Validate your configurations in out-of-the-box analyses and metrics
Prerequisites
Before beginning this tutorial, you will need:
- A Visier account that has the following profiles. If you don't have an account, contact your administrator.
- Visier Cloud Administrator
Data Engineer
Basic Model Developer orAdvanced Model Developer
- Loaded data and a data version. For more information, see Bring Data In and Data Versions.
-
A Visier account with a permission that allows the user to access guidebooks, analyses, the Explore room, and data access to view the data you're configuring in the solution experience. For more information, see Data and Content Security.
- Ad Hoc Analysis
- Create Analysis Context
- Change Analysis Context
- Guidebook
- View Details
Sample data
Caution: We don't recommend using the sample data in production environments where data is already loaded.
This tutorial begins where the Upload Data Files Using the Solution left off. If you want to follow along with this tutorial, we recommend that you Download the employee sample data files and complete the previous tutorial.
Steps
Figure out what needs to be configured
After loading data for the first time and generating a data version, you must map your data values to concepts in Visier. This allows us to start analyzing our data. Concept mapping is the definition of what your data means in Visier by configuring data values to align to concepts.
Note: Wait, didn't I already map my data?
If you completed the tutorial Upload Data Files Using the Solution, you may be wondering why this analytic model tutorial includes more mapping. After uploading data for the first time, you map your data columns to analytic objects in Visier's Blueprint. You already did that in the previous tutorial!
After your data is mapped to the Blueprint, you can now map specific data values from within your columns to concepts in Visier. This allows you to harmonize the data and categorize it under standardized semantic groups.
Let's say you mapped your Employee source data to the Employee subject in Visier. This connects all the columns in your source data, like EmployeeID and Employment_Status, to the corresponding attributes (Employee ID property and Employment Status dimension) in the Employee subject. In this tutorial, you will map the values inside these columns to concepts in Visier, for example, mapping the values Active and On Notice (from the Employment_Status column) to the Current Employee concept, which is populated by the Employment Status dimension.
Before we can start concept configuration, we need to figure out if there are any objects in Visier that need to be configured. There are many ways to figure out what concepts need to be configured. We can:
- Check the Data Issues room
- Review property and dimension dependencies
- Review metric dependencies
- Review all concepts
Let's begin by opening a project in Studio to hold our work. In the previous tutorial, we created a project called Visier Tutorial with a description of Load, configure, and publish essential Employee data. For more information, see Upload Data Files Using the Solution.
To open a project:
- On the global navigation bar, click Projects.
- Under Draft projects, select the project where you have loaded data and a data version.
Check the Data Issues room
In a project, the Data Issues room displays any data issues in a data version. It will show us a list of concepts we need to configure or update based on the data we've loaded. However, this is not a complete list.
To navigate to the Data Issues room:
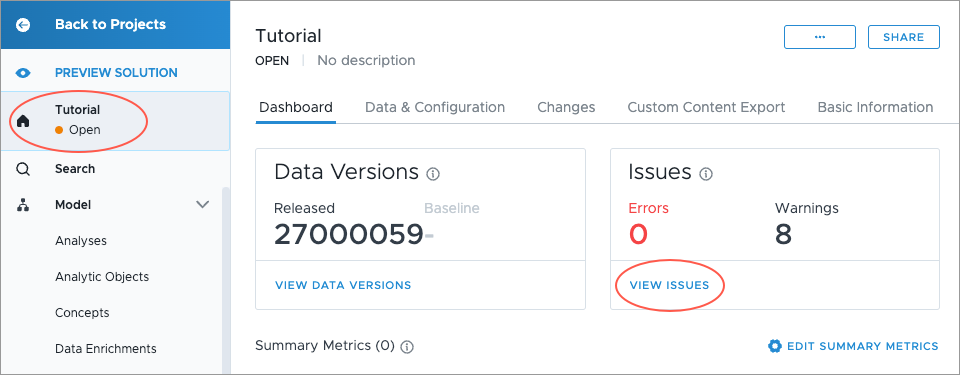
- In a project, on the navigation bar, click the Home button
 .
. - In the Dashboard tab, in the Issues area, click View Issues.
This redirects you to Validation > Data Issues, a room that lists the unconfigured concepts based on the project's data version.
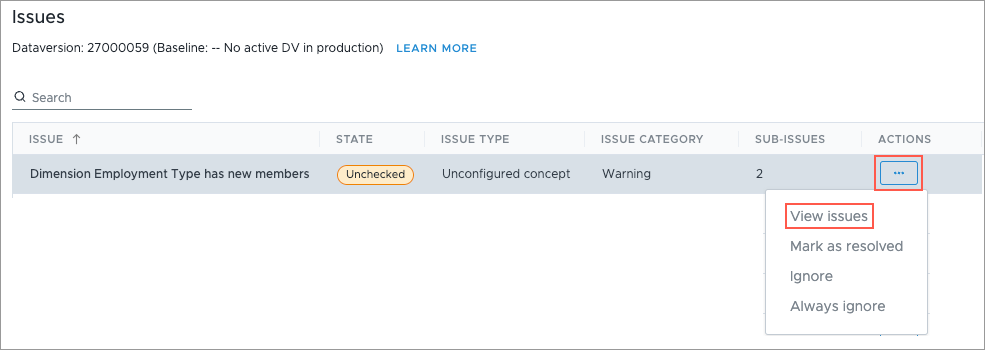
In this tutorial, we are interested in the issues with the Issue Type: Unconfigured concept.
For example, we get the following issue in the Data Issues room: "Dimension Employment Type has new members". This means that there's new dimension members (data values) for the Employment Type dimension. Let's dig deeper into the issue by hovering over the issue and clicking View issues in the Actions column.
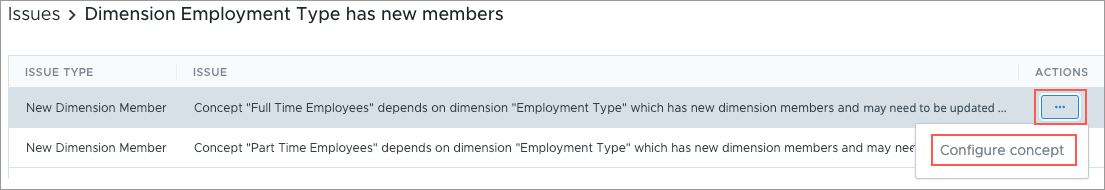
When we navigate into the issue, we can see that Full Time Employees and Part Time Employees concepts are configurable. If you want, you can configure the concepts by hovering over the sub-issue, in the Actions column, click the More button ![]() > Configure concept.
> Configure concept.
This is one method to find and configure concepts. We'll configure all the concepts later in this tutorial in the Concepts room.
Review property and dimension dependencies
Another way to figure out what concepts we need to configure in order for the pre-built content to work is to look at the dependencies for the properties and dimensions that we loaded and mapped data for.
For example, in the previous tutorial, we loaded and mapped data to the Critical Employee Status dimension. We can look at the dependencies for this dimension to see what concepts we need to configure.
To review property and dimension dependencies:
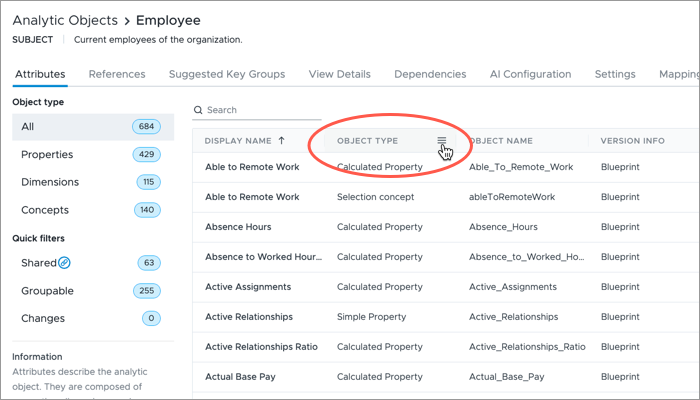
- In the project, on the navigation bar, click Model > Analytic Objects.
- Select the analytic object you loaded data into. In this example, we will select Employee because Critical Employee is a dimension of the Employee subject.
- In the Attributes tab, select a property and dimension that you mapped. In this example, we will select the Critical Employee dimension.
- In the Dependencies tab, under Descendants, expand the Selection Concept Configuration list to see the concepts that depend on this dimension. We will need to configure these concepts so they can be used to analyze the data.
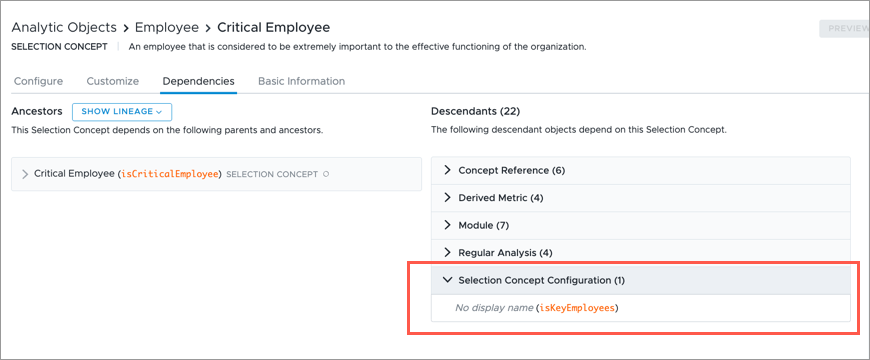
In this example, we will have to configure the following concepts:
- isKeyEmployees
To generate a list of concepts to configure, we can look at the dependencies for the simple properties, leveled dimensions, and parent-child dimensions that we loaded and mapped data for. To focus on these items, we can apply a filter to the Object Type column in the Attributes tab of the analytic object.
Review metric dependencies
Concepts can be used to create metrics, so we can also review metric dependencies to determine the concepts we need to configure.
In this tutorial, we are interested in the Full-Time Equivalents metric. We can look at the dependencies for this metric to see if it requires a concept.
To review metric dependencies:
- In the project, on the navigation bar, click Model > Metrics.
- Select a metric of interest. In this example, we will select the Full-Time Equivalents metric.
- In the Dependencies tab, under Ancestors, expand the tree to see the items that the metric depends on to work correctly.
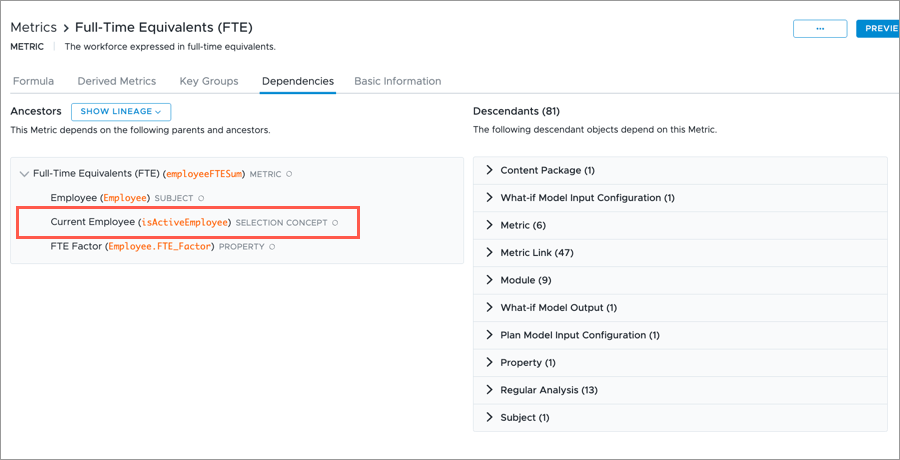
In this example, we will have to configure the following concepts in order for this metric to work:
- isActiveEmployee
To generate a list of concepts to configure, we can look at the dependencies for the metrics that we are interested in. To help us understand what each metric measures, we can add the Description column.
Review all concepts
We can also review the full list of concepts available to us to determine what concepts we need to configure.
To review all concepts:
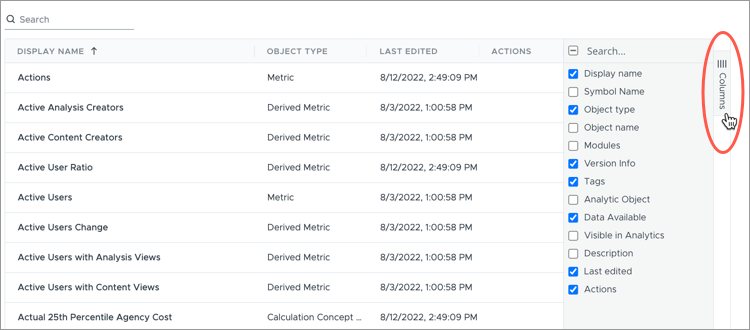
- In the project, on the navigation bar, click Model > Concepts.
- Add the Description column to understand what the concept does.
- Make a list of the concepts that interest you.
If the Data Available column is No, this means the concept needs to be configured or additional data needs to be loaded for it to work.
Select the concept to see what is required. If you see a message in the Configure tab that says This dimension does not have data, you will need to load additional data before you can configure the concept.
To determine what data you need to load, click the Dependencies tab, under Ancestors, expand the tree to see the items that the concept depends on to work correctly.
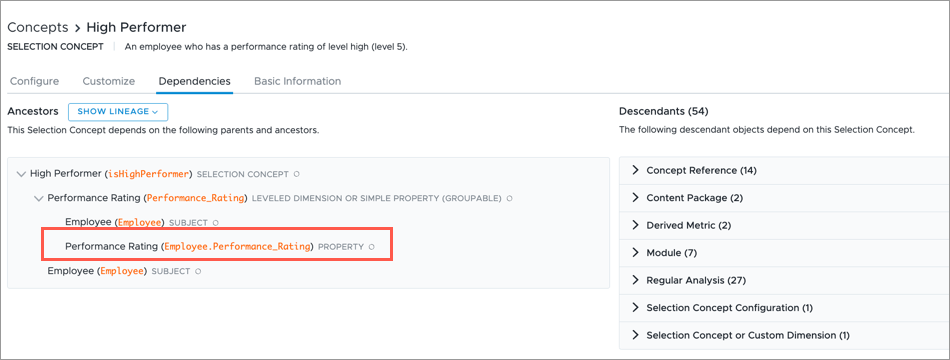
In this example, we need to load and map data to the Performance Rating property before we can configure and use the High Performer concept.
Configure concepts
To make it easy, we will be configuring the following concepts in this tutorial:
- Critical Employee
- Current Employee
- Employee Exit Model
- Employee Movement
- Employee Starts Model
- Full Time Employees
- Is Permanent Employee
- Majority (US)
- Man
- Minority (US)
- Top Talent
- Woman
Note: Depending on your data, there may be different dimension members available to select. In this tutorial, we will suggest certain selections based on the sample data, however, you can select any members you want.
Introducing the visual title and analysis context
As part of concept configuration, we will go through validation steps to confirm that the data is correct by comparing it against the source data. This will involve interacting with visualizations to change the data that is displayed.
Use the various elements to analyze your data and build a visual to suit your needs.
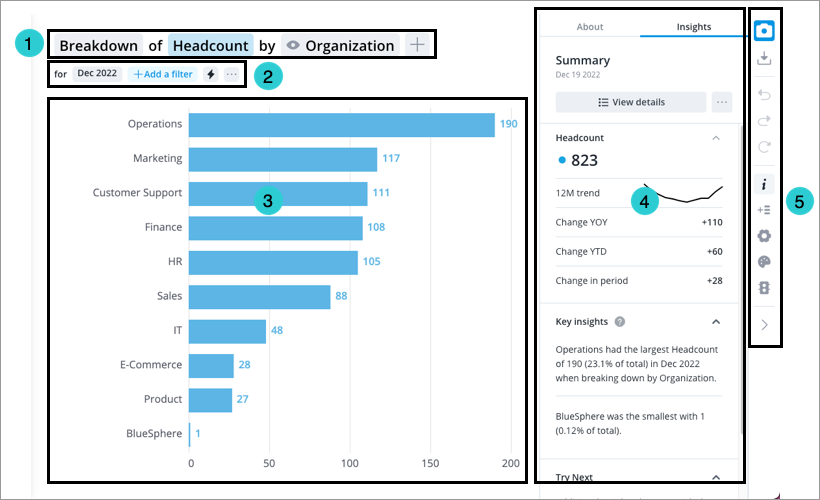
- Visual title: Describes and controls the data that is displayed in the chart. Click the Metric picker, Visual picker, and Group By picker in the visual title to change the data that is displayed. For more information, see The Visual Title.
- Analysis Context toolbar: Change the Analysis Context to select the population and time period for analysis. For more information, see The Analysis Context.
- Chart: Graphical representation of one or more metric.
- Side panel: View contextual information about selected metrics and data points, customize the appearance of your chart, and change chart configurations.
- Visual Actions menu: Use these quick access buttons to perform chart actions and open chart customization and configuration options in the Side panel. For more information, see Visual Actions Menu.
Configure calculated selection concepts
First, we'll configure the only required calculated selection concept, Current Employee. For this concept, we need to change the selection type from Calculated to Member. By default, Current Employee is a calculated selection concept whose formula is true. This means that the concept will select all employees with data, not just employees who are considered “active” by your organization’s definition. By changing to a member selection concept, we can define which values indicate an employee is currently active in the organization.
- In a project, on the navigation bar, click Model > Concepts.
- In the list of concepts, search for and select Current Employee.
- In Current Employee, navigate to the Customize tab.
- Select Member.
- In the Convert dialog, select Employee. Click Convert.
- In the Customize tab, in the Selected dimensions area, click Add Dimensions.
- In the Add Dimensions dialog, search for and select Employment Status, and then click Add.
- Navigate to the Configure tab.
- In the list of Employment Status members, select Active and On Notice. This means that if an employee in our data has an Employment Status of Active or On Notice, Visier will count them as a Current Employee.
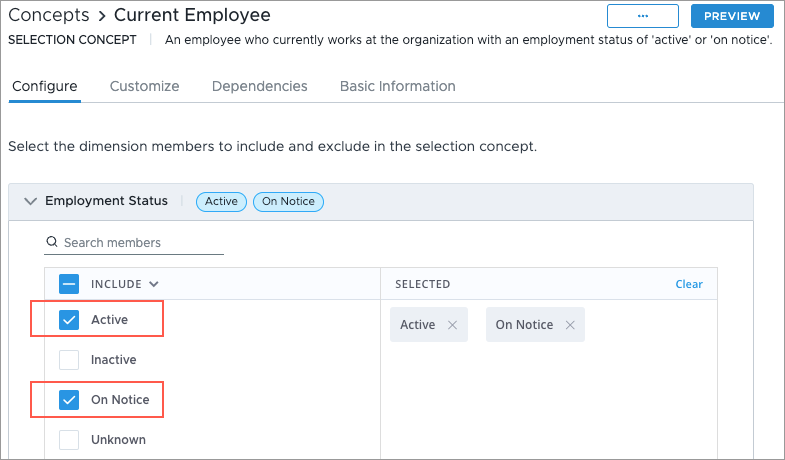
Result: The Current Employee concept is configured!
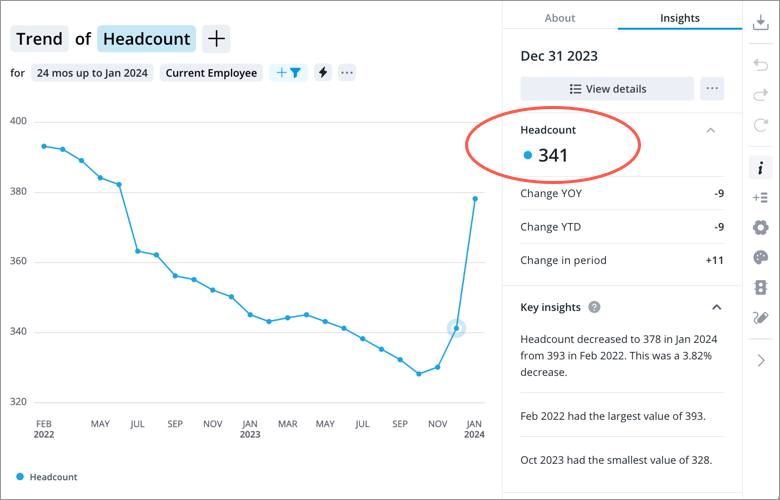
- To view your changes, click Preview. In the visualization, select the December 2023 data point, and confirm that the data is correct by comparing it against your source data. In the sample data, we have 341 current employees on December 31, 2023, which you can see reflected in the following preview visualization. The preview visualization matches our source data, which means we configured the concept accurately!
Configure member selection concepts
Next, let's configure the remaining member selection concepts. To configure member selection concepts, we need to select the values (called "members" in Visier) from our data and assign them to concepts.
Example: Current Employee
If we assign the members Active and On Notice to the concept Current Employee, then all employees whose employment status is either Active or On Notice in our data will be included in the Current Employee group or filter when used in visualizations and analyses.
- In a project, on the navigation bar, click Model > Concepts.
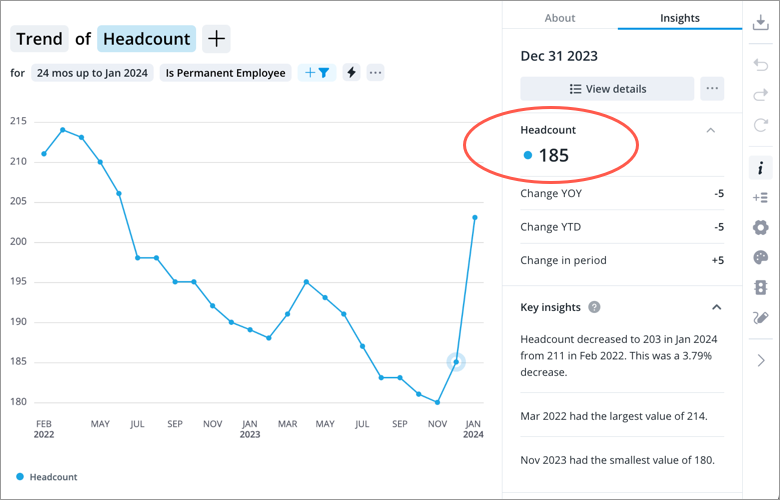
- In the list of concepts, search for and select Is Permanent Employee.
-
In Is Permanent, in the Configure tab, in the list of values, select TRUE. If an employee in your data has a Permanent status of TRUE, Visier will count them as a Permanent Employee, employees who are hired on a permanent basis.
Result: The Is Permanent Employee concept is configured!
-
To view your changes, click Preview. In the visualization, select the December 2023 data point, and confirm that the data is correct by comparing it against your source data. In the sample data, we have 185 permanent employees on December 31, 2023, which you can see reflected in the following preview visualization.
- Repeat steps 2-4 for the following member selection concepts. When validating remember to select the December 2023 data point in your preview visualizations.
- Critical Employee: Select the member TRUE. In the sample data, we have 163 critical employees on December 31, 2023.
- Full Time Employees: Select the member Full-Time shifts. In the sample data, we have 298 full time employees on December 31, 2023.
- Majority (US): Select the member White. In the sample data, we have 182 employees who are classified as majorities on December 31, 2023.
- Man: Select the member Male and Transgender Man. In the sample data, we have 253 employees who identify as a man on December 31, 2023.
- Minority (US): Select the members Hispanic or Latino, Black or African American, Native Hawaiian or Other Pacific Islander, Asian, American Indian or Alaska Native, Two or More Races, and Unknown. In the sample data, we have 159 employees classified as minorities on December 31, 2023.
- Top Talent: Select the member TRUE. In the sample data, we have 60 employees identified as top talent on December 31, 2023.
- Woman: Select the member Female and Transgender Woman. In the sample data, we have 74 employees who identify as a woman on December 31, 2023.
Configure calculation concepts
Next, we can configure the required calculation concepts: Employee Exit Model and Employee Starts Model. To configure calculation concepts, we need to select the values (called "members" in Visier) from our data and assign them to the concept's hierarchy nodes. For more information about calculation concepts, see Concepts.
- In a project, on the navigation bar, click Model > Concepts.
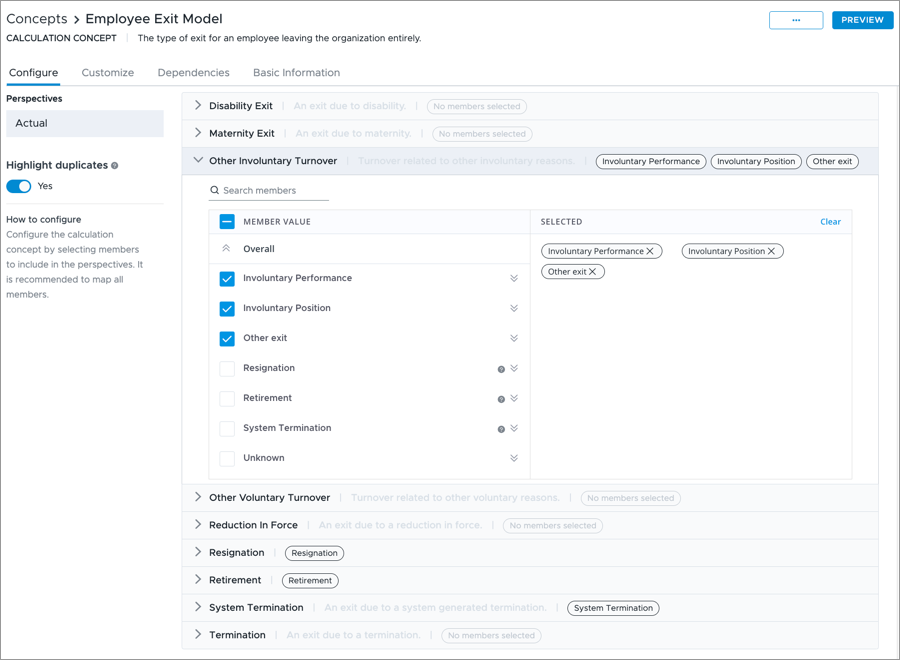
- In the list of concepts, search for and select Employee Exit Model.
- In Employee Exit Model, in the Configure tab, select the following members for each exit type (hierarchy node):
- Disability Exit: Don't select any members. The sample data in this tutorial does not have Disability Exit values.
- Maternity Exit: Don't select any members. The sample data in this tutorial does not have Maternity Exit values.
- Other Involuntary Turnover: Select the members Involuntary Performance, Involuntary Position, and Other exit.
- Other Voluntary Turnover: Don't select any members. The sample data in this tutorial does not have Other Voluntary Turnover values.
- Reduction in Force: Don't select any members. The sample data in this tutorial does not have Reduction in Force values.
- Resignation: Select the member Resignation.
- Retirement: Select the member Retirement.
- System Termination: Select the members System Termination.
- Termination: Don't select any members. The sample data in this tutorial does not have Termination values.
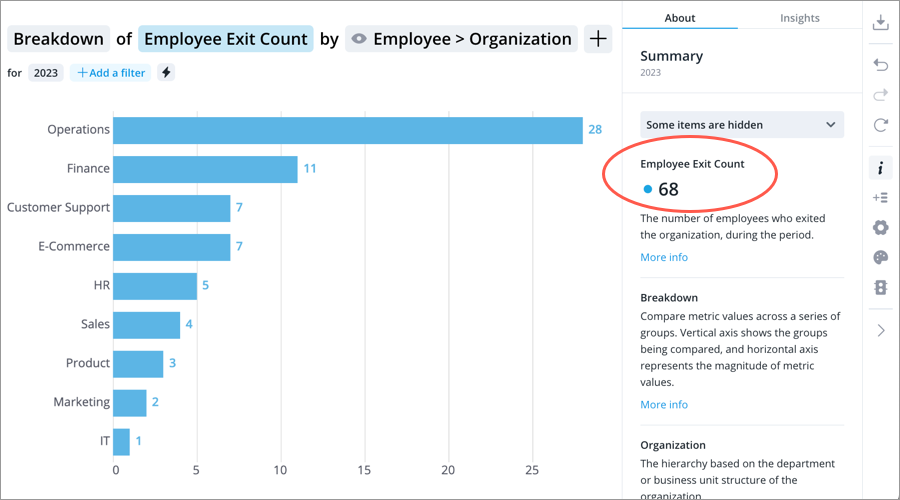
-
To view your changes, click Preview. In the visualization, change the visual type to Breakdown, select the Employee Exit Count metric, change the time granularity to Years, and change the time period to 2023. Then confirm that the data is correct by comparing it against your source data. In the sample data, we have 68 employee exits in 2023.
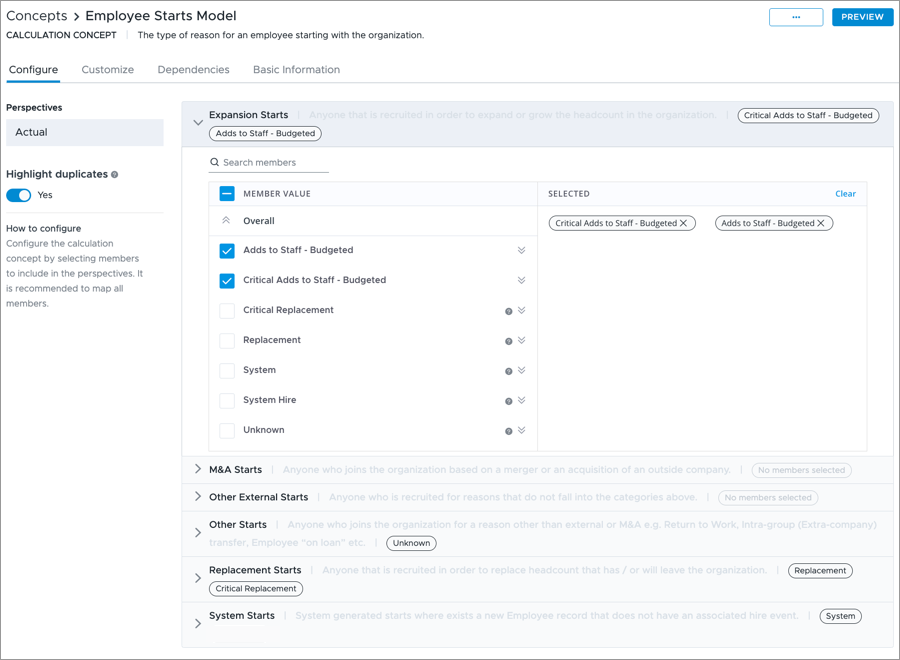
- Close the preview and return to the Concepts room. In the list of concepts, search for and select Employee Starts Model.
- In Configure, select the following members for each start type:
- Expansion Starts: Select the member Adds to Staff - Budgeted and Critical Adds to Staff - Budgeted.
- M&A Starts: Don't select any members. The sample data in this tutorial does not have M&A Starts values.
- Other External Starts: Don't select any members. The sample data in this tutorial does not have Other External Starts values.
- Other Starts: Select the member Unknown.
- Replacement Starts: Select the members Critical Replacement and Replacement.
- System Starts: Select the member System.
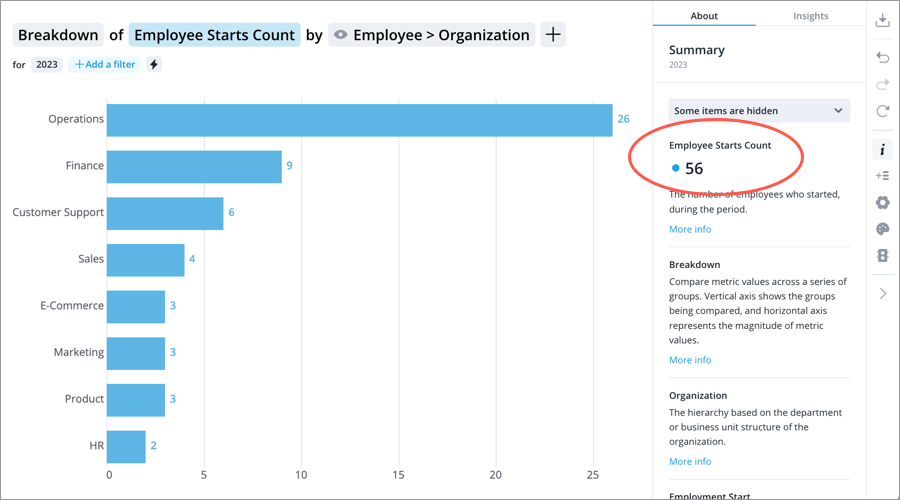
-
To view your changes, click Preview. In the visualization, change the visual type to Breakdown, select the Employee Starts Count metric, change the time granularity to Years, and change the time period to 2023. Then confirm that the data is correct by comparing it against your source data. In the sample data, we have 56 employee starts in 2023.
Configure movement concepts
Next, we can configure the required movement concepts: Employee Movement. To configure movement concepts, we need to select the dimensions which will track moves in, out, and within your selected population. If no dimension is configured, all movements will be counted in "Others in/out". For more information about movement concepts, see Concepts.
- In a project, on the navigation bar, click Model > Concepts.
- In the list of concepts, search for and select Employee Movement.
- In Employee Movement, in the Configure tab, select the following dimensions for each movement type:
- Move in/out dimensions: Select the dimensions Location and Organization.
- Move within dimensions: Select the dimensions Location and Organization.
-
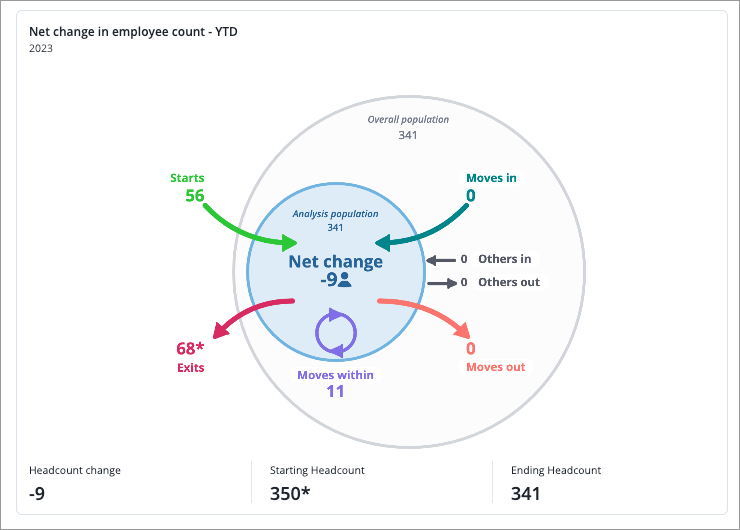
To view your changes, click Preview. In the visualization, change the time granularity to Years and change the time period to 2023. Then confirm that the data is correct by comparing it against your source data. In the sample data, we have 56 starts , 68 exits, and 11 moves within for 2023.
Preview and validate in the solution
Note: If you open the solution experience and can't access any analyses or the Explore room, you may not have the correct permission capabilities. For more information, see Data and Content Security.
Now that we've configured all the necessary concepts, we need to confirm that the data for employee, employment start, employee exit, and organization hierarchy is being shown accurately in the solution. This is done by previewing the data in the solution in either the Guidebooks room or Explore room.
- The Guidebooks room is where you can view prebuilt analyses to get insights into your business questions. This is a great place to start and includes a Validate Your Data topic to help guide you.
- The Explore room is where you can conduct most of your ad hoc analysis in the solution and customize visuals to suit your needs.
For this tutorial, we will preview and validate data in the Explore room.
- In the project, on the navigation bar, click Preview Solution.
Result: The analytics solution opens in preview mode.
- On the navigation bar, click Explore.
- In the visual title, click the Metric picker. Search for the metric or a metric related to the data we want to validate.
- Verify the solution data matches our source data.
In this tutorial, we can build the following visuals to validate the data. Based on the sample data and our concept configurations, you should see the following visualizations and values when you set the analysis context to December 2023.
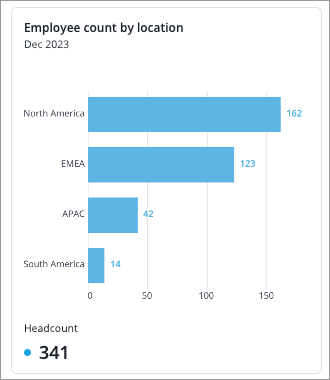
Breakdown of Headcount by Location
- Headcount: 341
- North America: 162
- EMEA: 123
- APAC: 42
- South America: 14
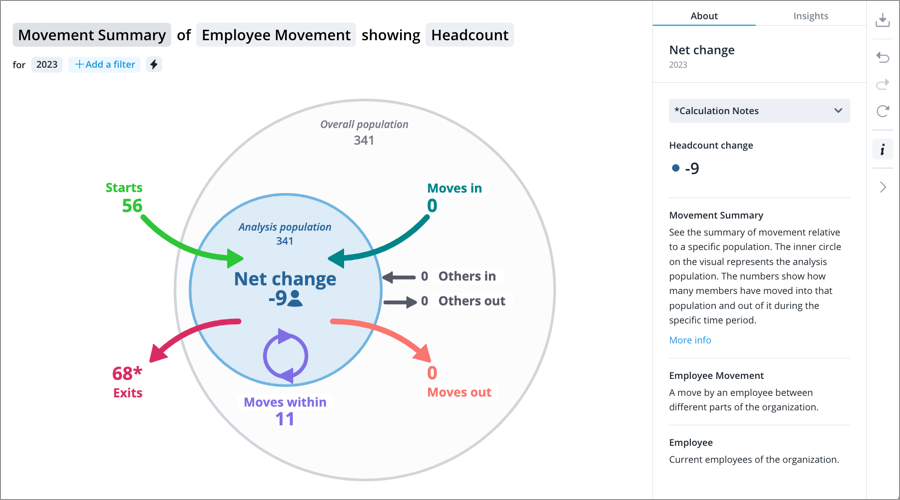
Movement Summary of Employee Movement showing Headcount
- Headcount change: -9
- Starting Headcount: 350
- Ending Headcount: 341
When validating the data consider:
- Changing the time period of the analysis to ensure data is loaded for the same time periods that the source data covers.
- Build visualizations that make use of the concepts we configured such as Full Time Employees and Woman.
- Checking metric values for groups and individuals that you’re most familiar with such as your own department.
- Checking Detailed View to ensure the correct members are showing up for a particular time period and grouping. For example, look at Headcount on the IT Team and validate the list of employees in Detailed View.
Tip: You can also build a collection of visualizations in the Analyses room in case you need to reload your data or change configurations. For more information, see Create an Analysis.
After we verify the solution data matches our source data, we have successfully set up the analytic model in Visier.
Commit project changes
Now that we’ve successfully set up the analytic model, it’s a good time to commit our changes. Committing changes acts as a save point for your project.
- In the project, on the navigation bar, click the Home button .
- Click the Changes tab in the project home.
- Click Commit All.
- In the Commit Changes to Project Revision dialog, type a name and description for the project revision. We can name our revision Concept Configuration with a description of Finished set up of analytic model.
- Click Commit now.
Publish the project
At this point, you might choose to publish your project so that the changes are available in production. For more information, see Publish Project Changes. If you choose not to publish, only you and anyone with access to the project can see your changes.
If you want to follow along with the other tutorials in this series, we recommend that you publish the project. In this tutorial, you’re essentially publishing your people analytics solution for the first time.
- In the project, on the navigation bar, click the Home button .
- Click the Changes tab in the project home.
- Commit any uncommitted changes.
- Click Release to Production in the upper-right corner of the project.
- In the Release to Production dialog, type a name, description, and release version, and then click Release now. We can name our release Visier People with the description Initial release.
Result: A new production version of the solution is created.
Next steps
Now you know how to configure concepts after loading data in the Visier solution. This tutorial walked you through how to figure out what concepts to configure, access those concepts in a project, and configure selection concepts and calculation concepts.
After configuring concepts, you can start expanding your Visier solution! You can start creating your own unique analyses, concepts, metrics, and more.
In the next tutorial, you will enhance the analytic model by creating a new property, dimension, concept, and metric to analyze the average age at which part-time employees join your organization. For more information, see Create New Employee Attributes and Metrics.