
Upload Data Files Using the Solution
Learn how to upload your initial employee data files using the Visier solution.
Introduction
There are multiple ways to load data into Visier, including Visier's data connectors, the Direct Data Intake API, and file upload. The method you choose will be dependent on your specific needs and overall ecosystem.
If your data is stored on a secure file server that only authorized users can access and decrypt or if you prefer to download data from your database, prepare it, and then upload it into Visier, the file upload method is recommended.
Depending on your requirements, Visier offers different options for uploading data files:
- Visier Solution: This option is particularly useful for initial data onboarding, testing, and conducting ad hoc data uploads. For more information, see File Upload Using the Solution.
- Data Upload API: This API allows you to programmatically send data files to Visier. It's a convenient alternative to SFTP. For more information, see Data Upload API.
- Secure File Transfer Protocol (SFTP): Allows you to automate the file upload process by scheduling a data load frequency. This is a great option to use after onboarding your initial dataset into Visier. For more information, see File Upload Using SFTP.
In this tutorial, you will learn how to upload your initial employee data files using the Visier solution.
Objectives
We will first walk you through how to upload your first data files in a new Visier tenant, and then take you through how to generate sources for your data. After sources are created, we will show you how to create and configure mappings for each source. This will connect the source files' columns to the properties in Visier’s analytic objects. We will then show you how to run a job to generate a data version.
By the end of this tutorial, you will have successfully uploaded data files to use in the solution.
In our example, we will be uploading our initial employee data files which includes employee, employee starts, employee exits, and organization hierarchy. This will allow us to analyze employee starts and exits in Visier.
You will learn how to:
- Upload data files using the Visier solution
- Generate sources
- Create and configure mappings to specify how data in your source is loaded into Visier
- Run a job to generate a data version
- Preview the data in the solution
Prerequisites
Before beginning this tutorial, you will need:
- A Visier account that has the following profiles. If you don't have an account, contact your administrator.
Data Engineer
-
A Visier account with a permission that allows the user to access guidebooks, analyses, the Explore room, and data access to view the data you’re loading. For more information, see Data and Content Security.
- Ad Hoc Analysis
- Create Analysis Context
- Change Analysis Context
- Guidebook
- View Details
Steps
Prepare data files
To make it easy, we have sample data files that you can load, so you can follow along.
Caution: We don't recommend using the sample data in production environments where data is already loaded.
Download the sample data files.
The compressed file includes sample data for employee, employee starts, employee exits, and organization hierarchy:
- employee_tutorial.csv
- employment_start_tutorial.csv
- employee_exit_tutorial.csv
- organization_hierarchy_tutorial.csv
Before we upload our data into Visier, we need to make sure our data files are in the expected format, and follow the recommended file structure and naming conventions. This in an important step as it ensures our files will be successfully uploaded to the solution. To learn more about how to structure your data files, see Data File Guidelines.
Additionally, each data file has specific fields that are required when uploading so we need to ensure we include data for those fields. For example:
The Employee data file needs to include data for the following required fields:
-
Snapshot Date
-
Employee ID
-
Employment Status
The Employee Start data file needs to include the following required fields:
-
Event Date
-
Employee ID
-
Employment Start Type
The Employee Exit data file needs to include the following required fields:
-
Event Date
-
Employee ID
-
Termination Reason
The Organization Hierarchy data file needs to include the following required fields:
-
Snapshot Date
-
Organization ID
-
Parent Organization ID
To learn more about the required and recommended fields for each data file, see Visier Data Dictionaries.
For the purposes of this tutorial, we can skip this step as the sample data files are in the expected format and all required fields are included.
Upload data files in the Visier solution
After our data files have been prepared, the next step is to upload them within Studio, which serves as the administrative design space. To learn more about Studio, see Navigate Studio.
After you sign in to Visier, you are directed to the solution experience or Studio. This is dependent on capabilities, permissions, and if you’ve previously loaded data into Visier.
- Sign in to Visier.
- Do one of the following:
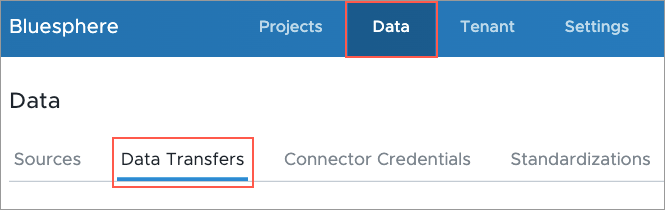
- If you start in the solution experience, on the navigation bar, click Studio
 to access Studio, and then click Data > Data Transfers.
- If you start in Studio, on the global navigation bar, click Data > Data Transfers.
- If you start in the solution experience, on the navigation bar, click Studio
- Compress the data files you want to upload in a ZIP file. You can also upload CSV, XLS, XLSX, and PGP-encrypted files. We can skip this step because the sample data comes as a compressed file. The ZIP file contains data files for employee, employee starts, employee exits, and organization hierarchy.
- Click Upload File and select the compressed sample data file you downloaded previously. In this tutorial we're uploading the file Tutorial_Essentials_Sample_Data.zip.
- Click Upload.
Note: If you upload an XLS or XLSX file containing multiple sheets, each sheet will create a unique data transfer.
Result: The data files are encrypted and uploaded to a secured file server.
Generate sources
Now that our data files have been uploaded to the solution, we need to generate sources for each file. Sources store data for your solution, for example, Employee data is stored in the Employee source. For more information, see Sources.
Note: If it’s your first time uploading this type of data, the data transfer will fail validation because there is no source connected to it. To resolve this failure, generate a source as described next. If you have previously uploaded this type of data, your data transfer automatically connects to its existing source.
Let's start by generating a source for the employee file.
To generate a source:
- In the Data Transfers tab, hover over the uploaded file.
- In the Actions column, click the Generate source button
 .
.Result: A source is created.
Repeat the above steps for the uploaded employee start, employee exit, and organization hierarchy files. In this tutorial, you will generate the following sources:
- employee_tutorial
- employment_start_tutorial
- employee_exit_tutorial
- organization_hierarchy_tutorial
We can check our sources to verify the data was extracted correctly.
- On the global navigation bar, click Data > Sources.
- Select a source and click the Uploaded Files tab.
- Check the latest uploaded file and confirm that the number of records is correct in the Records column. There should only be one file for each source as this is the first time we have loaded this data.
The following table describes the number of records for each file.
|
Source |
File |
Number of Records |
|---|---|---|
|
employee_tutorial |
employee_tutorial.csv |
10956 |
|
employment_start_tutorial |
employment_start_tutorial.csv |
649 |
|
employee_exit_tutorial |
employee_exit_tutorial.csv |
260 |
|
organization_hierarchy_tutorial |
organization_hierarchy_tutorial.csv |
628 |
We can also check the Columns tab to ensure all the expected columns have been loaded and that each column has the correct data type. In this tutorial, we want to look at the columns to familiarize ourselves with the sample data.
Create a project
Next, we need to create a project in Studio to hold our work. Projects are how Visier handles version control, allowing you to define and edit the solution separately from the current production version of the solution. For more information, see Use Projects for Version Control.
- On the global navigation bar, click Projects.
- In the Projects room, click New Project.
- In the New Project dialog, type a name and description for the project. We can name our project Visier Tutorial with a description of Load, configure, and publish essential Employee data.
- Click Create.
Result: The project home appears.
Create a data category
Now that we’ve created a project, we need to create a data category for our data.
A data category represents a dataset loaded into Visier that runs on a unique data load frequency. Each data category has its own set of instructions to generate a data version. A data version is a instance of uploaded data with a unique release number. For more information, see Data Versions.
The "instructions" within a data category bring together the mappings from source data to objects in Visier's analytic model.
- In the project, on the navigation bar, click Data > Data Categories.
- Click Create Data Category.
- In the Create data category dialog, type a display name and description. We can name our data category Visier Tutorial Data with a description of Instructions to load data for tutorial.
- Click Create.
Result: The data category is created.
After a new data category is created, Visier generates a new tenant setting, Tenant_Design_0, and automatically assigns it to the data category. Tenant settings define information about the tenant, including the data start and end dates. This tenant setting should be automatically assigned to the data category.
Check that the tenant setting is assigned to the data category:
- In the data category, click the Settings tab.
- Under Tenant setting, ensure Tenant_Design_0 is selected.
Note: Start date prior to 12/31/2004
By default, the start date for Tenant_Design_0 is 12/31/2004. If the data you're loading has a start date prior to 12/31/2004, you must update the start date in the tenant setting. If you're using the sample files, you can skip this step because the sample data does not contain a start date prior to 12/31/2004.
Update tenant start date:
- In the project, on the navigation bar, click Data > Tenant Settings.
- Select the auto-generated tenant setting, Tenant_Design_0.
- In the Settings tab, under Start date explicit date, type or select the start date for your data. For more information, see Tenant Settings.
Create mappings
Next, we need to create mappings for each of our sources. Mappings connect the source files' columns to the properties in Visier's analytic objects. For more information, see Mappings.
Let’s start with our employee data and create a mapping for our employee source.
To create a mapping:
- In the project, on the navigation bar, click Data > Mappings.
- Click Create Mapping.
- In the Create mapping dialog, in Data category, select the data category you created. In this tutorial, we named our data category, Visier Tutorial Data.
- In Mapping type, select the appropriate mapping type. In this tutorial, we will select Regular for all the mappings. For more information about mapping types, see Mappings.
- Type a display name and a description for the mapping. We can name our mapping Employee Mapping with a description of Data extraction rules for the employee analytic object.
- Select the source and its corresponding data load target. Because we're starting with our employee data, we will select employee_tutorial as our source and Employee as our data load target. The following table describes which data load target we will be selecting in this tutorial.
Source
Data Load Target
employee_tutorial
Employee
employment_start_tutorial
Employment_Start
employee_exit_tutorial
Employee_Exit
organization_hierarchy_tutorial
Organization_Hierarchy
- In Data type, select the correct data type for the source. In this tutorial, our employee data is Transactional profile. The following table describes which data type we will be selecting in this tutorial.
Source
Data Type
employee_tutorial
Transactional profile
employment_start_tutorial
Conception event
employee_exit_tutorial
Termination event
organization_hierarchy_tutorial
Transactional profile
Note: The data type is dependent on how the source data is formatted. For more information about mapping data types, see Add a Mapping.
- In Override behavior, select the correct override behavior for the mapping. The override behavior defines how the loader uses newer records to overwrite older records. For more information, see Add a Mapping. In this tutorial, we will use the default override behavior for each mapping.
- Click Create.
Result: The mapping is created.
After we create mappings for the rest of our sources, it's time to configure each mapping.
Configure mappings
Once we have created our mappings, we need to map the source columns to the analytic object properties. This can be done by utilizing the automap feature which streamlines the mapping process through string matching.
Let's start with our employee mapping.
- In Mappings, select the mapping that you want to configure.
-
In the mapping, click Automap
 .
.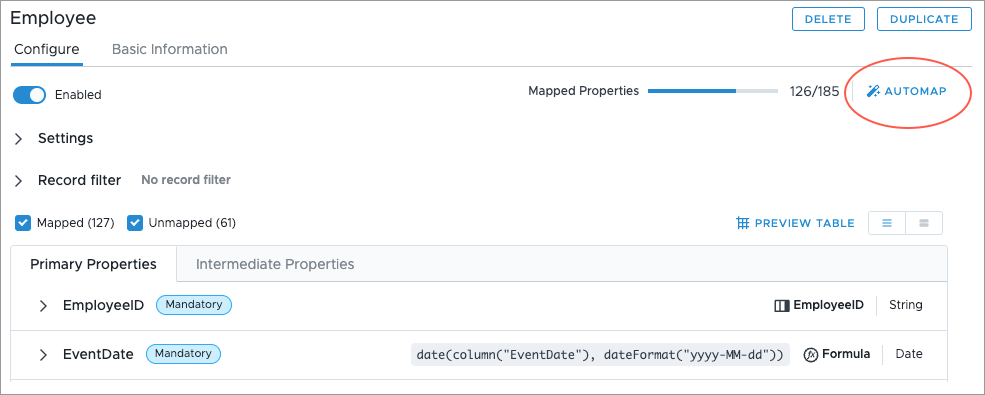
Result: The properties with matching source columns are mapped.
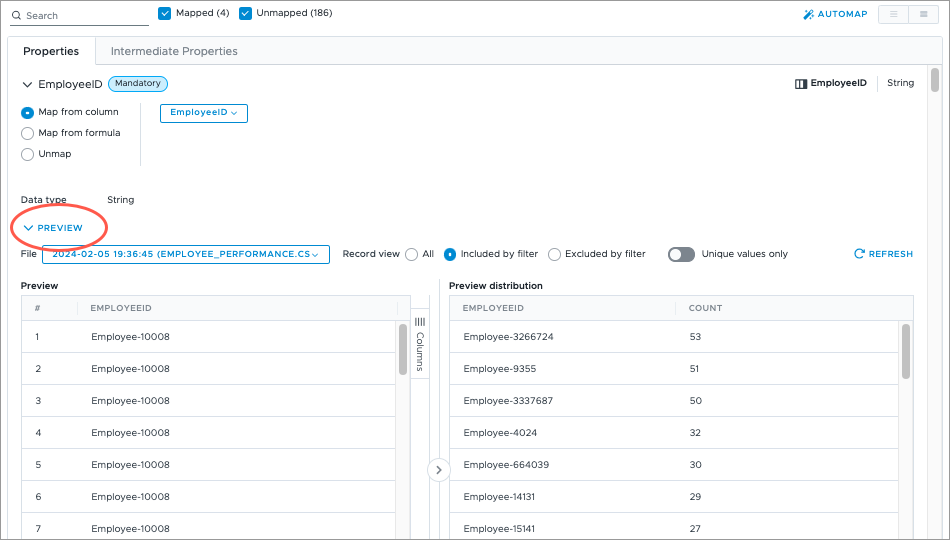
- In Properties, check the mapped items to ensure all your source columns were correctly mapped to a property. A property is mapped correctly if it shows the correct source column name or formula. For example, EmployeeID is mapped to the EmployeeID column and not the Birth_Date column. You can preview the records in the mapping by clicking Preview.
Once we're satisfied with our employee mapping, we will have to configure the rest of the mappings to map the source columns to the analytic object properties.
Add business rule
In this tutorial, our employee data is transactional. To correctly use this data in Visier, we need to create a business rule that create profiles from transactions for the Employee subject, which will ensure the headcount is correct when we validate the data.
Note: What is transactional data?
Transactional profile is a hybrid of temporal and transactional log types. The data excludes any unchanged records and includes each changed record in its entirety. The data is wide, where each row is included if one or more attributes have changed. The time associated with the change is included in the record.
Transactional data, both log and profile types, are less verbose than temporal data and require more data business rules to create system events. To determine what type of data you’re loading, see Add a Mapping.
To add a business rule:
- In the project, on the navigation bar, click Data > Rules.
- In the Business Rules tab, click Create Rule.
- In the Create rule dialog, in Data category, select the data category you created. In this tutorial, we named our data category, Visier Tutorial Data.
- In Rule type, select Business rule.
- Type a display name. We can name our business rule Employee Conception and Termination Rule.
- Select the subject for the business rule. In this tutorial, we are selecting Employee as the subject of the business rule.
- Type a description. For example, Create profile conceptions and terminations based on events.
- In Formula, type call call createProfilesForCTEvents(). This generates profile conception and termination events from actual conception and termination events.
- Click Create.
Result: The business rule is created.
- In the business rule we created, in the Configure tab, click Validate.
Run a job to generate a data version
Once we've created and configured our mappings, it's time to run a job from our data category to generate a new data version, this will allow us to preview the data in the solution. Jobs define the tasks needed to load your data into Visier, for more information, see Jobs.
- In the project, on the navigation bar, click Data > Data Categories.
- On the data category we created for our data, in the Actions column, click the More button
 . In this tutorial, we named our data category, Visier Tutorial Data.
 - Click Run job.
- In the Configure Data Loader dialog, click Run job. In this tutorial, we'll use the default job settings.
To check the status of the job, navigate to Data > Jobs.
- In the Status tab, click Refresh. The job should now appear in the list.
If successful, a release number appears in the Data Version column. This means a data version is generated and the job is complete.
Set the data version
If the data version release behavior is set to manual release or custom release, you will have to change the data version of your project in order to preview the new data version.
To set the data version:
- In a project, on the navigation bar, click Data > Data Categories. For more information, see Set the Data Version.
Check that data is available in the solution
Note: If you open the solution experience and can’t access any analyses or the Explore room, you may not have the correct permission capabilities. For more information, see Data and Content Security.
Now that we've generated a data version, we need to confirm that data has been loaded and appears in the solution. At this point, we are not concerned about the accuracy of the values that we see in the solution because we still need to set up the analytic model for the metrics to work correctly. In the next tutorial, we will configure concepts and validate our data.
To preview the solution:
- In the project, on the navigation bar, click Preview Solution.
Result: A preview version of the solution opens in a new tab.
We will use the Explore room to check that data has been loaded. The Explore room is where you can conduct most of your ad hoc analysis in the solution and customize visuals to suit your needs.
To navigate to the Explore room, click Explore ![]() on the navigation bar.
on the navigation bar.
Use the various elements to analyze your data and build a visual to suit your needs.
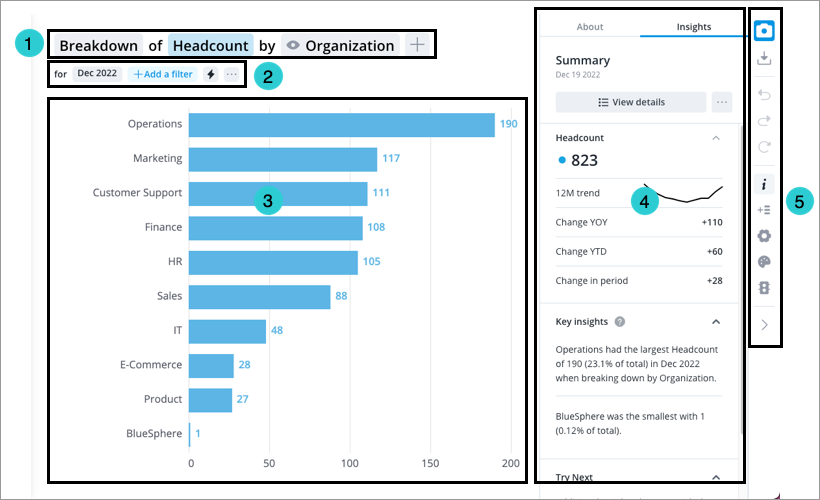
- Visual title: Describes and controls the data that is displayed in the chart. Click the Metric picker, Visual picker, and Group By picker in the visual title to change the data that is displayed. For more information, see The Visual Title.
- Analysis Context toolbar: Change the Analysis Context to select the population and time period for analysis. For more information, see The Analysis Context.
- Chart: Graphical representation of one or more metric.
- Side panel: View contextual information about selected metrics and data points, customize the appearance of your chart, and change chart configurations.
- Visual Actions menu: Use these quick access buttons to perform chart actions and open chart customization and configuration options in the Side panel. For more information, see Visual Actions Menu.
To build a visualization and check data in the Explore room:
- In the visual title, click the Visual picker and select the Breakdown visual.
- In the visual title, click the Metric picker and select a metric. In this tutorial, let's select the Headcount metric.
- In the visual title, click the Group By picker and select an attribute to organize the data. In this tutorial, let's select Organization.
- Check that the visualization loads and you values appear for your groupings.
- In the analysis context, click the Time picker. Click to change the granularity, time period, and time window to ensure data has been loaded for the time periods that your source data covers.
If our visualizations load and we see values, then we have successfully loaded data into Visier.
Commit project changes
Now that we’ve confirmed that data has been loaded, it’s a good time to commit our changes. Committing changes acts as a save point for your project.
- In the project, on the navigation bar, click the Home button
 .
. - Click the Changes tab in the project home.
- Click Commit All.
- In the Commit Changes to Project Revision dialog, type a name and description for the project revision. We can name our revision Initial Data Load with a description of Generated data version.
- Click Commit now.
Next steps
Now you know how to upload your initial employee data files using the Visier solution. This tutorial walked you through how to upload data files in the Visier solution, generate sources, and map those sources to objects in Visier’s analytic model, as well as how to generate a data version to preview the data in the solution.
After loading data, you will learn how to configure concepts to connect your data values to Visier’s analytic model.
In the next tutorial, you will learn how to configure concepts to connect your data values to Visier’s analytic model. For more information, see Configure Concepts After Loading New Data.