Mappings
Mappings specify how data in your sources is loaded into Visier.
Access requirements
Profiles: Data Engineer
Custom profile with these capabilities: Data (Read, Simple)
Reach out to your administrator for access.
Overview
A mapping connects two entities, such as columns in a source to attributes in a data load target (the subject or event). For example, you might map the Hair_Color column in your employee data file to the Hair Color property in the Employee subject. By mapping your data to an object in Visier, you can then analyze that data in Visier.
To access mappings, open a project and navigate to Data > Mappings or Model > Analytic Objects and then select an object and click Mappings.
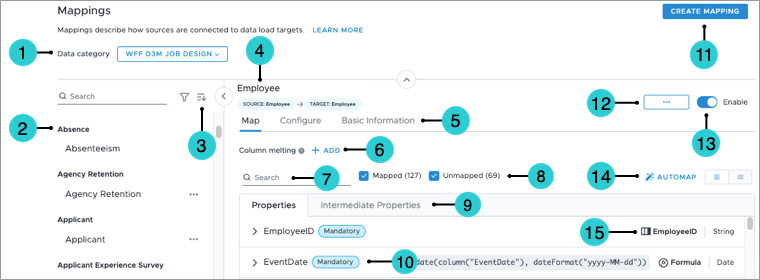
The following screenshot shows the Data > Mappings room.

- Data category: The data category that the mapping belongs to. For more information, see Data Categories.
- Mappings list: The list of all mappings in the selected data category. If you click the More button
 next to a mapping, you can do the following actions:
- Add to custom content export: Add the mapping to the list of custom content available for export. For more information about the custom content export, see Export Custom Content.
- Disable: Disable the mapping.
- Delete: Delete the mapping.
- Sort options: Options to sort the mappings list by alphabetical, analytic object, mapping type, last edited, type description, or source. You can also sort the list in ascending or descending order.
- Selected mapping: The current selected mapping. You can configure the selected mapping's settings, basic information, and mapped properties.
- Map, Configure, and Basic Information: Different rooms in which to change a mapping.
- Map: Map properties to data columns.
- Configure: Change the mapping's settings, including the record filter, mapping type, and override behavior. For more information, see Add a Mapping.
- Basic Information: Change the mapping's display name or description.
- Column melting: The columns to melt. For more information, see Configure a mapping.
- Search: Quickly find a specific property.
- Mapped/Unmapped filter: Options to filter the list of properties by mapped properties or unmapped properties.
- Properties: The mappable properties and intermediate properties associated with the mapping.
- Mandatory: If mandatory, the property must be mapped to a column or formula. If a mandatory property is unmapped, any data versions that include the associated analytic object will fail.
- Create Mapping: Option to create a new mapping. For more information, see Add a Mapping.
- More button
 : Option to add to custom content export, delete, or duplicate the selected mapping.
 - Enabled: Whether the mapping is enabled or disabled. If disabled, the mapping is not included in future data versions.
- Automap: Option to automatically connect source columns to data load target properties by matching similar names. We recommend using Automap the first time you map properties in a new mapping.
- Mapping selection: Whether the property is mapped to a column or formula, and the property's data type. If mapped to a column, the column name is shown. If mapped to a formula, the formula is shown.
Tip: To see how your existing mappings connect to sources, rules, and objects in Visier, see Data Flow Visualization.
In this section
