
Create a Subject to Analyze Expense Report Data
Learn how to create a new subject in Visier, including adding properties, loading data, and creating a data version.
Introduction
If you have additional use cases beyond the out-of-the-box content in Visier, you can create new subjects in the analytic model to accomplish your organization's goals.
In this tutorial, you will learn how to create a new Expense Report subject, add properties, dimensions, and concepts to the subject, load data for the subject, and generate a data version to validate employee expense reports.
If you aren't familiar with Visier's analytic model, take a moment to read Understand Visier's Analytic Model.
Objectives
In this tutorial, we'll walk you through the decision-making process to determine whether the object you want to create is a subject, and find out if anything similar already exists in Visier. We will then take you through how to create the subject and any attributes and metrics it requires. After the objects are created, we'll walk through loading Expense Report data and mapping the data to the new objects in Visier. By the end of this tutorial, you will be able to use the new subject you created in analyses and visualizations.
In our example, we will extend the analytic model by creating a net new subject.
You will learn how to:
- Identify whether to create a subject, event, or overlay
- Identify whether to create properties, dimensions, or concepts
- Investigate if similar objects already exist in the analytic model
- Create a subject and its attributes
- Upload new data files using the Visier solution
- Generate sources to store your data files in Visier
- Create mappings from your data to the subject in Visier
- Run a job to generate a data version
- Preview your newly-created subject in the solution experience
Prerequisites
- Loaded Employee data and a data version. For more information, see Bring Data In and Data Versions.
- A Visier account that has the following profiles. If you don't have an account, contact your administrator.
Data Engineer
Advanced Model Developer
-
A Visier account with a permission that allows the user to access guidebooks, analyses, the Explore room, and data access to view the data you're using in the solution experience. For more information, see Data and Content Security.
- Ad Hoc Analysis
- Create Analysis Context
- Change Analysis Context
- Guidebook
- View Details
Sample data
Caution: We don't recommend using the sample data in production environments where data is already loaded.
The following sample files are referenced in this tutorial:
- Employee files that were previously loaded and published. If you followed previous tutorials, you likely already loaded this data. You can optionally replace these files. For more information, see (Optional) Replace employee data files in the Visier solution. Download the employee sample data files.
- New employee files to replace the previously-loaded and published employee files. For more information, see (Optional) Replace employee data files in the Visier solution. Download the new employee sample data files.
- Expense Report file. Download the employee expense report sample file.
To learn how to load employee sample data files, see Upload Data Files Using the Solution. To learn how to configure the analytic model, see Configure Concepts After Loading New Data. This tutorial focuses on extending the analytic model by creating a new subject, properties, dimension, and metric.
Steps
Determine your business case
As an organization, you want to track and analyze employee expense spending. Because your Visier solution already has employee data, you can easily bring in employee expense report data and connect it to Employee data in Visier to address your use case. By building objects to analyze expense report data, you can independently extend Visier's analytic model to answer your unique business case.
Next, you need to figure out what data you have. For expense reports, we need data for expense report IDs, the dates associated with the report (created, submitted, approved, paid), the claim amount, the amount paid to the employee, the currency code, and the report status (created, submitted, approved, paid). If you have the required data, you can move forward with extending Visier's analytic model. If you don't have the required data, you can download expense_report_tutorial.csv to complete this tutorial. If you're using your own data, the data columns and display names may be different than those referenced in this tutorial.
Note: The Employee IDs in your expense report data must match the Employee IDs in your previously-loaded employee data.
Decide what to create
Let's say your CEO wants to understand how much money is spent on expense reports every quarter. To adequately analyze expense reports, you'll need the following information in Visier:
- A container to hold all details about an expense report.
- Attributes of the expense report, including the report's ID, the date it was created, submitted, approved, and paid, as well as the total amount of money the employee claimed in the report, the amount due to the employee as approved by your finance team, the currency code for the amount due and approved, and the status of the report, such as submitted, approved, and paid.
- A metric that calculates the total value of expense reports during the quarter.
This is the minimum amount of information to bring into Visier so that you can answer your CEO's business question.
Next, ask yourself what kind of container you should design the expense reports as. In Visier, analytic objects (subject, events, and overlays) are containers with attributes. Is Expense Report best designed as a subject, an event, or an overlay? To figure that out, review these guidelines.
Create a subject if:
- The entity has a lifespan and you can analyze changes in its state over time.
- The entity has events associated with it at different points in time.
- The entity's state is stable for some period of time.
- The entity has a history over time.
Create an event if:
- The data observes transactional behavior that happens to an entity at a particular time instant.
Create an overlay if:
- The object stores aggregate values for a population. It doesn't store individual members' attribute values.
- The object contains aggregated data that Visier can compare against metrics and concepts.
- The object isn't connected to any other analytic objects.
- The object doesn't require Detailed View access.
Let's say our Expense Report data file looks like this:
|
EventDate |
EmployeeID |
Expense_ReportID |
Date_Created |
Date_Submitted |
Date_Approved |
Date_Paid |
Total_Claimed_Amount |
Amount_Due |
Report_Status |
Currency_Code |
|---|---|---|---|---|---|---|---|---|---|---|
|
2023-11-24 |
Employee-14861 |
ExpenseReport-11437288 |
2023-11-24 |
|
|
|
1493 |
1493 |
Created |
USD |
|
2023-12-07 |
Employee-14861 |
ExpenseReport-11437288 |
2023-11-24 |
2023-12-07 |
|
|
1493 |
1493 |
Submitted |
USD |
|
2023-12-19 |
Employee-14861 |
ExpenseReport-11437288 |
2023-11-24 |
2023-12-07 |
2023-12-19 |
|
1493 |
1493 |
Approved |
USD |
|
2024-01-01 |
Employee-14861 |
ExpenseReport-11437288 |
2023-11-24 |
2023-12-07 |
2023-12-19 |
2024-01-01 |
1493 |
1493 |
Paid |
USD |
When thinking about expense reports, we can make the following statements:
- An expense report has a lifespan from created to paid. You can analyze changes in the report's state over time.
- An expense report can have events associated with it at different points in time, such as expense line items with transaction dates.
- An expense report's state is stable for some period of time, such as in the Submitted state or Approved state.
- An expense report has a history over time, such as Created on November 24, Submitted on December 7, Approved on December 19, and Paid on January 1.
- An expense report doesn't observe transactional behavior that happens to it, rather, it observes stable states, like Expense Report ID, Date Created, and Amount Due.
- An expense report doesn't store aggregate data. It is directly linked to a specific individual through Employee ID.
- An expense report is connected to other analytic objects in Visier, specifically Employee.
- An expense report requires Detailed View access.
Based on the above, we should create a subject to represent expense reports in Visier. In addition to the subject, we also want to create attributes on Expense Report so that we can analyze specific data from the data file.
Analytic objects have attributes (properties, dimensions, and concepts) that describe and give meaning to the object. Based on the columns in our data, Expense Report is an analytic object that has the following attributes:
- Employee ID
- EventDate
- Expense Report ID
- Currency Code
- Date Created
- Date Submitted
- Date Approved
- Date Paid
- Total Claimed Amount
- Amount Due
- Report Status
To decide whether an attribute should be created as a property, dimension, or concept, use these guidelines.
Create a property if:
- The attribute evaluates the analytic object on a per-ID basis. For example, the Age property evaluates on each employee ID to provide an age for every employee.
- The attribute won't be used as a group by in visualizations.
- The attribute can be used in other objects, like metric formulas or dimensions.
Create a dimension if:
- The attribute groups data. For example, the Age Range dimension groups employees into specific age ranges based on the Age in Months property.
- The attribute will be used as a filter or group by in visualizations.
- The attribute can be used in other objects, like concepts or custom dimensions.
Create a concept if:
- The attribute gets its values from a property or dimension.
- The attribute will be used as a filter or group by in visualizations.
- The attribute reclassifies data from other objects into new groups, such as:
- Selects values that fit into the same group. For example, Millennials is a concept that selects all employees with a Birth_Date property between January 1, 1981 and December 31, 1996.
- Selects values to represent hierarchical relationships between calculations. For example, Employee Exit Model is a concept that groups exit-related calculations into a hierarchy where Resignation, Retirement, and Other Voluntary exits roll up to calculate Voluntary Turnover.
- Selects values to represent the processes or sequences that an analytic object goes through. For example, Applicant Process is a concept that groups applicants by the stages of their application, such as Applied, Screen, Interviews Started, Offered, and Background Checked.
- Selects values to represent movement that an analytic object experiences. For example, Employee Movement is a concept that groups changes to an employee's location or organization as a move in, out, or within a location or organization.
Let's take our list of Expense Report attributes and decide what type of object to design them as based on the above guidelines. We can make the following statements about the Expense Report attributes:
- Employee ID: Because Employee already exists in Visier, we can connect the Expense Report subject to the Employee subject with a subject reference. The reference takes care of EmployeeID for us, so we don't have to create it as an attribute on Expense Report.
- EventDate: Required for mapping but not required as an attribute on Expense Report. We won't create an EventDate attribute, but we will map it in the Mappings room. Mapping the EventDate column from our data determines the x-axis of visualizations that use Expense Report metrics.
- Expense Report ID: Evaluates on a per-ID basis to provide a value for each expense report, not useful as a group by, can be used in other objects, like metric formulas or dimensions, and doesn't reclassify data from other objects into new groups. Expense Report ID should be designed as a simple property.
- Currency Code: Evaluates on a per-ID basis to provide a currency code for each expense report, not useful as a group by because our sample data is only in one currency (USD), can be used in other objects, like Total Claimed Amount and Amount Due, and doesn't reclassify data from other objects into new groups. Currency Code should be designed as a simple property.
- Date Created, Date Submitted, Date Approved, and Date Paid: Evaluates on a per-ID basis to provide a date for each expense report, not useful as a group by, can be used in other objects, like metric formulas or dimensions, and doesn't reclassify data from other objects into new groups. The Date attributes should be designed as simple properties.
- Total Claimed Amount and Amount Due: Evaluates on a per-ID basis to provide a value for each expense report, not useful as a group by, can be used in other objects, like metric formulas or dimensions, and doesn't reclassify data from other objects into new groups. The Amount attributes should be designed as simple properties.
- Report Status: Groups data into specific statuses, useful as a group by or filter, can be used in other objects, like concepts or custom dimensions. Report Status should be designed as a leveled dimension.
Note: After you create a leveled dimension, Visier generates a special property with an automatically-generated display name. This happens so that the property can evaluate on a per-ID basis. In this example, we want to group by Report Status which is why we'll make it a leveled dimension, but we still need to evaluate each expense report's status, so Visier generates the Report Status automatically. The special property won't be visible in Expense Report's list of attributes, but we can add the property to Detailed View. Later in this tutorial, we will map the Report_Status column from our source data to the Report_Status_Report_Status_LevelDim_Prop property (your property may have a different automatically-generated display name) on the Expense Report subject, which provides data for both the Report_Status property and dimension.
After all the required objects are created, we can then create a metric to answer our CEO's question: Total Value of Expense Reports.
Next, we need to determine if Visier has already modeled our business question. The first thing we can do is look at the analytic objects to see if there's an out-of-the-box object that we can load data into that represents what we want to analyze or aggregate data for.
To explore the analytic objects in Studio:
- On the global navigation bar, click Projects.
- Open the Production project.
- In the project, click Model > Analytic Objects.
- Look through the list of analytic objects and their descriptions to see if there's an object that represents what you want to analyze. In this tutorial, we can start with a keyword search for Expense. We want to find any expense-related objects to find if our objects already exist in the model. By searching Expense, we will find all attributes with "Expense" in the display name. In this tutorial, Expense Report doesn't exist yet in the analytic model, so there should be no results for expense reports. Because Expense Report doesn't exist, we can assume that its attributes and related metrics don't exist either. We will create them in this tutorial as well.
Tip: To make your search easier, apply a filter to the Object Type column. You can also take a look at the application definitions to see a complete list of the out-of-the-box content that comes with your purchase. For more information about application definitions, see Download the Application Definition.
- If you can't find an object to load your data into, check our offerings to purchase additional applications. If it is not modeled, you can build your own objects to extend the analytic model.
Create a project
Next, we need to create a project in Studio to hold our work. Projects are how Visier handles version control, allowing you to define and edit the solution separately from the current production version of the solution. For more information, see Use Projects for Version Control.
- If you are in the Production project, click Back to Projects.
- On the global navigation bar, click Projects > New Project.
- In the New Project dialog, type a name and description for the project. We can name our project Onboard Expense Report with a description of Creating Expense Report subject and related objects.
- Click Create.
Result: The project home appears.
Create objects
In this section, we will create the following objects:
- Expense Report (subject)
- Expense Report ID, Currency Code, Date Created, Date Submitted, Date Approved, Date Paid, Total Claimed Amount, Amount Due (simple properties)
- Report Status (leveled dimension)
- Total Value of Expense Reports, Total Count of Expense Reports (metrics)
Note: Because we haven't loaded data yet, we won't be able to preview the objects as we go. We will preview and validate our objects after we load data and create a data version.
Create a subject
First, we'll create the subject object and then configure its settings. After the subject is finished, we can create properties for it.
- In the Onboard Expense Report project, on the navigation bar, click Model > Analytic Objects.
- Click Create Analytic Object.
- In Analytic object type, select Subject.
- In Display name, type Expense Report.
- In Description, type a description for the subject. In this tutorial, we'll type Summarizes an employee's expense report, but you can type any description you want.
- When finished, click Create.
Result: The Expense Report subject is created. In the Attributes tab, an ID property is generated too. Later in this tutorial, we will use that property for Expense Report ID. It comes with an automatically-generated display name, but you can change the display name to Expense Report ID.
Now that the subject is created, we can configure its settings.
- In Settings, define the object's settings, as described next:
- Tags: None. This setting is for content categorization, which we won't get into in this tutorial. For more information about tags, see Create and Assign Tags to Content.
- Events: None. In this tutorial, we won't create any events. This setting is for any events that reference the Expense Report subject. In this scenario, you might create an event like Expense Line Item.
- Captions: Expense Report ID. This is the ID property that was automatically generated after Expense Report was created.
- Primary key dimension: Disabled.
- Large dimension search: Disabled.
- Data version settings: Use default.
- Default metric: Total Value of Expense Reports. We haven't created this metric yet, so we'll have to come back later to set this up.
- Data category: Use default. In this tutorial, the default is Tenant, which represents the primary data category. If you followed the previous tutorials, the primary data category is Visier Tutorial Data.
- In References, we want to create a subject reference from Expense Report to Employee so that we can access relevant Employee data in relation to the expense report. For more information about references, see Analytic Objects. To add a reference to Employee, do the following:
- Click Add Reference.
- In Display name, type Employee.
- In Description, type a description. In this tutorial, we'll type The employee that this expense report is for, but you can write any description you want.
- In Explanation, do nothing.
- In Subject, search for and select Employee.
- Click Create.
- After creating the reference, in the Info panel
 , scroll down to Settings and turn on Binding reference. This means that each expense report must have an associated employee in the data.
Result: You can now add Employee properties like Employee ID to Detailed View for Expense Report. You can also map the Employee ID column from your data file to a new EmployeeReferenceID property.
- In Suggested Key Groups, do nothing. This setting is for suggesting selection concepts to users to filter the dataset while analyzing the subject in the solution experience, which we won't get into in this tutorial.
- In View Details, click Manage Properties. You can select any properties that you want to see in Detailed View. We haven't created the Expense Report properties yet, so we'll have to come back later to set this up.
- After you create the properties, come back to this step and select Amount Due, Date Approved, Date Created, Date Paid, Date Submitted, Expense Report ID, Report Status, Total Claimed Amount. To add EmployeeID, expand Employee and then select EmployeeID. When finished, click Update. This means users can view data for those properties in Detailed View if they have the correct data access.
Note: Click Reorder to change the order of the properties. This changes where the property shows up in the Detailed View list. In this tutorial, we reordered the properties to the following order:
- Expense Report ID
- Employee > Employee ID
- Report Status
- Date Created
- Date Submitted
- Date Approved
- Date Paid
- Total Claimed Amount
- Amount Due
- After you create the properties, come back to this step and select Amount Due, Date Approved, Date Created, Date Paid, Date Submitted, Expense Report ID, Report Status, Total Claimed Amount. To add EmployeeID, expand Employee and then select EmployeeID. When finished, click Update. This means users can view data for those properties in Detailed View if they have the correct data access.
- In AI Configuration, do nothing. This setting is for dynamic templates, which we won't get into in this tutorial. For more information about AI configuration and dynamic templates, see Configure AI Attributes.
- In Basic Information, change the Object name to Expense_Report.
Result: The platform updates all references to the new object name and refreshes the page. You may see a dialog asking you to confirm renaming all references to the new object name. Click Ok to update all references and refresh the page.
Create simple properties
Next, we'll create all the simple properties we want to add to Expense Report. Earlier, we identified these required properties:
- Expense Report ID
- Currency Code
- Date Created
- Date Submitted
- Date Approved
- Date Paid
- Total Claimed Amount
- Amount Due
All of the above properties are simple properties. When we first created Expense Report, it automatically generated an ID property. Before we create the rest of the properties, let's configure the ID property so that it has the correct display name and data type.
- In the Expense Report subject, in Attributes, click the ID property. In this tutorial, the automatically-generated display name is Expense_Report_SubjectID, but you might see a different name.
- In Customize, in Data type, select String.
- In Basic Information, in Object name, take note of the object name. We will use this object name in the metric formula. In this tutorial, the object name is Expense_ReportID, but yours may be different.
- In Basic Information, in Display name, change Expense_Report_SubjectID to Expense Report ID.
- In Basic Information, in Description, type The unique identifier for the report.
- When finished, return to the Expense Report subject.
Next, we'll create Currency Code. We have to create Currency Code before we create Total Claimed Amount and Amount Due because they are currency data that use the Currency Code property.
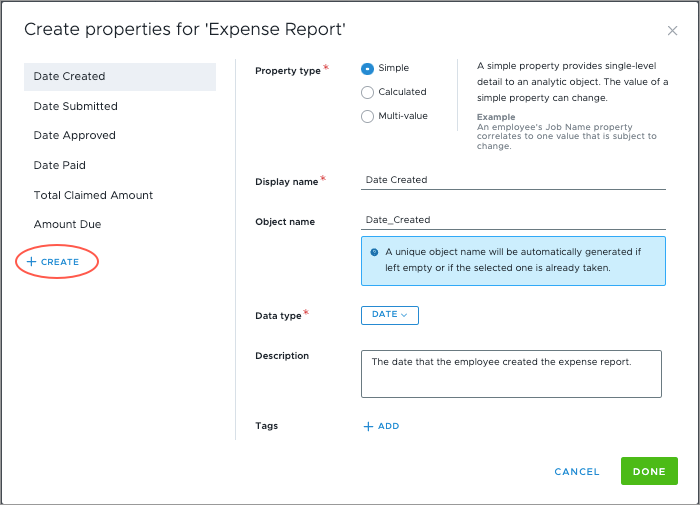
- In the Expense Report subject, in Attributes, click Create Attribute > Property.
- Select Simple.
- In Display name, type Currency Code.
- In Object name, type Currency_Code.
- In Data type, select Text.
- In Description, type The identifier code for the currency that the expense report is claimed and paid out in.
- When finished, click Done.
- Return to the Expense Report subject.
The following instructions walk you through how to create multiple simple properties and specifies the data type to select for each property.
Caution: Before continuing, refresh your browser. This makes Currency Code available to select in the Data Type for Total Claimed Amount and Amount Due.
- In the Expense Report subject, in Attributes, click Create Attribute > Property.
- Select Simple.
- Type a display name. Use the display names Date Created, Date Submitted, Date Approved, Date Paid, Total Claimed Amount, and Amount Due.
- Type an object name. If left empty, Visier generates an object name. If you have a specific object name convention, you can use it here. At Visier, we use underscores in our object names, so we would use the object names Date_Created, Total_Claimed_Amount, and so on.
- In Data Type, select the following data types for each property:
- Date Created: Date
- Date Submitted: Date
- Date Approved: Date
- Date Paid: Date
- Total Claimed Amount: Currency
- Currency code: Currency Code
- Amount Due: Currency
- Currency code: Currency Code
- Type a description. Feel free to write an informative description in your own words for each property.
- In Tags, do nothing. We won't add any tags in this tutorial. For more information about tags, see Create and Assign Tags to Content.
- When you finish a property, in the New property panel, click Create to create the next property. Repeat steps 2-6 for all properties.
- When finished, click Done.
Create a leveled dimension
To analyze expense report statuses, we can create a leveled dimension that has one level called Report Status. Leveled dimensions organize values into groups defined in your data; in this example, your data file would contain the column Report Status with values such as Created, Submitted, Approved, Paid.
When the dimension is used as a group by in a visualization, the dimension members (Created, Submitted, Approved, Paid) appear on the y-axis to categorize data into defined groups. When the dimension is used as a filter in a visualization, you can select a dimension member to filter the results by; for example, Total Value of Expense Reports by Organization filtered by Paid expense reports).
- In the Expense Report subject, in Attributes, click Create Attribute > Dimension.
- In Dimension type, select Leveled.
- Recommended: Turn on Make dimension shared. This allows you to use the dimension with other analytic objects in the future. If you turn off Make dimension shared, the dimension is not shared and you cannot convert it into a shared dimension in the future. For more information about shared dimensions, see Dimensions.
- In Display name, type Report Status.
- In Description, type a description for the dimension. In this tutorial, we'll type The current status of the expense report, but you can type any description you want.
- In Analytic objects, do nothing. Expense Report is already selected.
- In Tags, do nothing. We won't add any tags in this tutorial. For more information about tags, see Create and Assign Tags to Content.
- Click Done.
By default, the leveled dimension has one level in the Customize tab called Report Status, and its data type is String. In this tutorial, this is the correct level name and data type. If your data uses a different data type for Report Status, select the level in the Customize tab and, in the Info panel, select a different data type.
Next, let's change the leveled dimension's object name so that it follows our naming convention.
- In Report Status, click Basic Information.
- In Object name, replace the automatically-generated object name with Report_Status.
Now that all the properties and dimensions are created, return to the Expense Report subject and set the Detailed View properties (step 4 in Create a subject above). You may need to refresh the page.
Create metrics
To answer a business question, we can create a metric that calculates specific information. In this example, we want to answer the question of how much money we're spending on expense reports during a selected time period. We will name this metric Total Value of Expense Reports.
To write a metric formula, we must be familiar with the Visier Formula Language and the structure of a metric formula. Each formula contains:
- An analytic object. This is the object whose data you're calculating. In this example, we're calculating expense report data, so the analytic object is Expense_Report.
- A time handling statement. You can omit the time handing statement if you're using the object's default time handling option. In this example, we're using the default time handling for a subject, validUntil instant, so we'll omit time handling from the formula.
- A filter. This is an optional attribute to use in the calculation. In this example, we will filter by the Report_Status value Paid, Report_Status = "Paid", and by the Date_Paid column to ensure we're only including expense reports whose Date Paid is within the selected period, Date_Paid >= start(periodOf(instant)) && Date_Paid <= end(periodOf(instant)).
- An aggregation function. This is the type of calculation to do and on which property to perform the calculation. In this example, we're performing a sum calculation on the Amount_Due simple property.
Metric formulas start with the on function to define the object on which the calculation is performed, so we'll start the formula with on Expense_Report.
Next, we'll skip the time handling function, because we're using the default time handling for a subject.
Next, we can write the filter function filterBy and the properties we want to filter by: filterBy(Report_Status = "Paid" && Date_Paid >= start(periodOf(instant)) && Date_Paid <= end(periodOf(instant))). This states that the metric should only include expense reports whose status is "Paid" and whose "Date_Paid" column has a date greater than the start of the selected period and less than the end of the selected instant.
Next, we can specify how to perform the calculation. The function for aggregations is aggregate followed by the aggregation type. In this example, we'll use the aggregation type sum. When a metric is aggregating a specific property, that property follows the aggregation type: aggregate sum(Amount_Due).
All together: on Expense_Report filterBy(Report_Status = "Paid" && Date_Paid >= start(periodOf(instant)) && Date_Paid <= end(periodOf(instant))) aggregate sum(Amount_Due)
Tip: If you're unfamiliar with Visier's formula language, you can take a look at metrics in the analytic model to get a sense of how to structure a metric formula. In this tutorial, you could try to find other sum metrics to review their formulas before attempting to write your own.
- In Visier, in Studio, open a project and navigate to Model > Metrics.
- Search for and select Full-Time Equivalents. This metric is a sum of current employees' FTE value.
- In Full-Time Equivalents, in the Formula tab, review the formula box, which contains the following formula: on Employee validUntil instant filterBy(isActiveEmployee) aggregate sum(Employee.FTE_Factor).
We can apply this to our example by replacing the values in this formula with the values we specified for Total Value of Expense Reports: on Expense_Report filterBy(Report_Status = "Paid" && Date_Paid >= start(periodOf(instant)) && Date_Paid <= end(periodOf(instant))) aggregate sum(Amount_Due).
- We replaced Employee with our subject Expense_Report.
- We removed validUntil instant because it's not necessary for subject metrics using the default, which our metric is.
- We replaced filterBy(isActiveEmployee) with filterBy(Report_Status = "Paid" && Date_Paid >= start(periodOf(instant)) && Date_Paid <= end(periodOf(instant))) because our metric is filtering by the Paid report status and Paid dates within the period.
- We replaced Employee.FTE_Factor with Amount_Due because we're summing Amount Due. We don't need to specify that it's an Expense_Report property because the metric doesn't use any analytic objects other than Expense Report.
Now that we have the metric formula, we're ready to create the metric in Visier.
- In the Onboard Expense Report project, on the navigation bar, click Model > Metrics.
- Click Create Metric.
- In the Create metric dialog, type the following:
- In Display name, type Total Value of Expense Reports.
- In Description, type a description for the metric. In this tutorial, we'll type The total amount of money paid to employees for their expense reports, but you can type any description you want.
- Click Create.
Next, we'll finish setting up the new metric.
- In Total Value of Expense Reports, in the Formula tab, type on Expense_Report filterBy(Report_Status = "Paid" && Date_Paid >= start(periodOf(instant)) && Date_Paid <= end(periodOf(instant))) aggregate sum(Amount_Due) in the formula box.
- Click Validate. The formula should be valid. If you receive an error message, review the message and make any necessary changes to the formula or object names for Expense_Report or Amount_Due.
- Navigate to Settings and do the following:
- In Data type, select Currency.
- In Analytic object, select Expense Report.
- In Additive type, select Additive.
- Skip the other settings.
- Navigate to Basic Information and then change the Object name to Expense_Reports_Value.
Result: The platform updates all references to the new object name and refreshes the page. You may see a dialog asking you to confirm renaming all references to the new object name. Click Ok to update all references and refresh the page.
Now that the metric is created and configured, return to the Expense Report subject and set the Default metric setting (step 1g in Create a subject above).
In addition to Total Value of Expense Reports, let's create an additional metric called Total Count of Expense Reports. This metric will help us validate that the Report Status data is correct. We can't use the Total Value of Expense Reports metric to validate Report Status because it filters by Report_Status = Paid, meaning it only shows reports whose status is Paid. To validate Report Status, we want to see reports in all possible statuses.
Let's go through the same process to build the metric formula for Total Count of Expense Reports.
- In this example, we're calculating expense report data, so the analytic object is Expense_Report.
- In this example, we're using the default time handling for a subject, validUntil instant, so we'll omit time handling from the formula.
- In this example, we won't include a filter, so we'll omit a filter function from the formula.
- In this example, we're performing a count calculation on the Expense_ReportID property.
Metric formulas start with the on function to define the object on which the calculation is performed, so we'll start the formula with on Expense_Report.
Next, we'll skip the time handling and filter functions, because we're using the default time handling for a subject and we aren't filtering anything.
Next, we can specify how to perform the calculation. The function for aggregations is aggregate followed by the aggregation type. In this example, we'll use the aggregation type count. When a metric is aggregating a specific property, that property follows the aggregation type: aggregate count(Expense_ReportID).
All together: on Expense_Report aggregate count(Expense_ReportID)
- In the Onboard Expense Report project, on the navigation bar, click Model > Metrics.
- Click Create Metric.
- In the Create metric dialog, type the following:
- In Display name, type Total Count of Expense Reports.
- In Description, type a description for the metric. In this tutorial, we'll type The number of expense reports, but you can type any description you want.
- Click Create.
Next, we'll finish setting up the new metric.
- In Total Count of Expense Reports, in the Formula tab, type on Expense_Report aggregate count(Expense_ReportID) in the formula box.
- Click Validate. The formula should be valid. If you receive an error message, review the message and make any necessary changes to the formula or object names for Expense_Report or Expense_ReportID.
- Navigate to Settings and do the following:
- In Data type, select Integer.
- In Analytic object, select Expense Report.
- In Additive type, select Additive.
- Skip the other settings.
- Navigate to Basic Information and then change the Object name to Expense_Reports_Count.
Commit project changes
Now that we've confirmed that data has been loaded, it's a good time to commit our changes. Committing changes acts as a save point for your project.
- In the project, on the navigation bar, click the Home button
 .
. - Click the Changes tab in the project home.
- Click Commit All.
- In the Commit Changes to Project Revision dialog, type a name and description for the project revision. We can name our revision Object Creation with a description of Finished set up of Expense Report.
- Click Commit now.
Prepare data files
Before we upload our data into Visier, we need to make sure our data files are in the expected format, and follow the recommended file structure and naming conventions. This in an important step as it ensures our files will be successfully uploaded to the solution. To learn more about how to structure your data files, see Data File Guidelines.
Additionally, each data file has specific fields that are required when uploading so we need to ensure we include data for those fields. To learn more about the required and recommended fields for each data file, see Visier Data Dictionaries.
For the purposes of this tutorial, we can skip this step as the sample data files are in the expected format. We are uploading a new file that contains employee expense report data. Employee ID, Expense Report ID, and Event Date are required fields so we know which employee to attach the report data to, and when the expense report occurred.
In this tutorial, we are uploading completely new data to a new subject. To set up data in Visier, we must upload the data files, create sources in Visier, map the data to Visier objects, and then generate a data version to check our work.
(Optional) Replace employee data files in the Visier solution
The Employee IDs in your expense report data must match the Employee IDs in your previously-loaded employee data, however, the expense report sample data (expense_report_tutorial.csv) doesn't match the Employee IDs of previous sample data because sample data is machine-generated and different in every generation.
If you've been following along with previous tutorials, such as Upload Data Files Using the Solution, Configure Concepts After Loading New Data, Upload Additional Data to Analyze Employee Performance, and Create New Employee Attributes and Metrics, and uploaded Tutorial_Essentials_Sample_Data.zip, you may want to replace those files before continuing. If you don't replace the files, you can still complete this tutorial, however, you will see N/A values in EmployeeID when you validate the data.
Skip this section if you're using production data.
First, we'll delete the old files in the Data Transfers room, confirm that the deleted files are no longer included in the sources, and then upload new data files.
Because the new data files have the same filenames as the previous files, the new files will connect automatically to our existing sources. You do not need to create a new data category, generate sources, or create mappings for employee_tutorial.csv, employee_exit_tutorial.csv, employment_start_tutorial.csv, and organization_hierarchy_tutorial.csv. You will generate a source and create mappings for expense_report_tutorial.csv, as described in the rest of the tutorial.
Delete files
- In the Onboard Expense Report project, on the navigation bar, click Back to Projects.
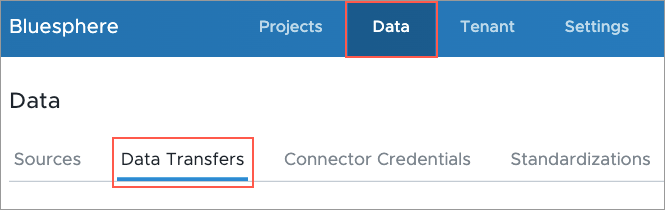
- On the global navigation bar, click Data > Data Transfers.
- Change the time filter from Last 24 Hours to Last 30 Days or Date range.
If you uploaded the files in the last 30 days, Last 30 Days should be sufficient. If you uploaded the files more than 30 days ago, set the Date range to include the dates that you uploaded the files.
- In the list of files, select the files and then click Delete. You should delete employee_tutorial.csv, employee_exit_tutorial.csv, employment_start_tutorial.csv, and organization_hierarchy_tutorial.csv.
Note: If you run into an error and can't delete the files, don't worry! You can still exclude the files from the source, which will have the same effect. See step 4 in Check that deleted files are not included in sources.
Check that deleted files are not included in sources
- On the global navigation bar, click Data > Sources.
- In the list of sources, select employee_tutorial.
- In the source, click Uploaded Files. The list should be empty, meaning that the files were deleted successfully.
- Optional: If the old files are displayed, in the Exclude/Include column, turn off the toggle so it says Excluded. The old file will not be included in the source anymore. Click Save.
If you aren't sure whether the file is old, check the Upload Time column to remember when you uploaded the file.
- Repeat steps 2-4 for employee_exit_tutorial.csv, employment_start_tutorial.csv, and organization_hierarchy_tutorial.csv.
Upload new files
- Download the new employee sample data files. For more information, see Sample data.
Result: Tutorial_Extend_Sample_Data.zip is downloaded to your computer.
- In Visier, on the global navigation bar, click Data > Data Transfers > Upload File.
- Select Tutorial_Extend_Sample_Data.zip.
Result: The ZIP file uploads to Visier. The files employee_tutorial.csv, employee_exit_tutorial.csv, employment_start_tutorial.csv, and organization_hierarchy_tutorial.csv should automatically connect to existing sources.
- To validate the files uploaded successfully, navigate to Data > Sources. In the Records column, confirm that each file has the following number of records:
- employee_tutorial.csv: 12675
- employee_exit_tutorial.csv: 328
- employment_start_tutorial.csv: 716
- organization_hierarchy_tutorial.csv: 785
Upload data files in the Visier solution
To upload the expense report data file in Studio:
- In the Onboard Expense Report project, on the navigation bar, click Back to Projects.
- On the global navigation bar, click Data > Data Transfers.
- Click Upload File and select the file on your computer. In this tutorial, we're uploading the expense_report_tutorial.csv file. For more information, see Sample data.
- Click Upload.
Generate sources
Now that our data file is uploaded to the solution, we need to generate a source for it. Sources store data for your solution, for example, Employee data is stored in the Employee source. For more information, see Sources.
Note: If it's your first time uploading this type of data, the data transfer will fail validation because there is no source connected to it. To resolve this failure, generate a source as described next. If you have previously uploaded this type of data, your data transfer automatically connects to its existing source.
To generate a source for an uploaded file, do the following:
- In the Data Transfers tab, hover over the uploaded file. In this tutorial, the file is expense_report_tutorial.csv.
- In the Actions column, click the Generate source button
 .
.
After generating the source, we want to verify the file was loaded correctly.
- On the global navigation bar, click Data > Sources.
- Select a source and click the Uploaded Files tab. In this tutorial, we will select the expense_report_tutorial source.
- Check the latest uploaded file and confirm that the number of records is correct in the Records column. There should only be one file as this is the first time we have loaded this data. In this tutorial, we are confirming that expense_report_tutorial has 79352 records.
Create mappings
Next, we need to create mappings for the source. Mappings connect the source files' columns to the properties in Visier's analytic objects. For more information, see Mappings.
In this tutorial, we will create a mapping for the expense_report_tutorial source.
To create a mapping:
- In the Onboard Expense Report project, on the navigation bar, click Data > Mappings.
- Click Create Mapping.
- In the Create mapping dialog, select the data category that was previously created for your tenant. In this tutorial, we'll select Visier Tutorial Data.
- In Mapping type, select the Regular mapping type. We selected Regular because we're uploading primary data to the Expense Report subject. For more information about mapping types, see Add a Mapping.
- In Display name, type Expense Report Mapping.
- In Description, type a description for the mapping. In this tutorial, we'll type Data extraction rules for expense report data, but you can write any description you want.
- Select the source and its corresponding data load target. We will select expense_report_tutorial as the source and Expense_Report as the data load target.
- In Data type, select the Transactional profile data type for the source. The data type is dependent on how the source data is formatted. In this tutorial, our expense report data is Transactional profile because each column in our file represents a property instead of key-value pair. For more information about mapping data types, see Add a Mapping.
- In Override behavior, select the Event date and subject member ID override behavior for the mapping. This means that Visier will ignore records in older files if a newer files contains records with the same event date and subject member ID (for example, EventDate: April 4, 2024 and Expense_ReportID: ExpenseReport-12344186). We chose this override behavior because it allows us to send a replacement data file for all expense reports if we need to. In this tutorial, we don't have to worry about override behavior because we won't be updating the data in the future. For more information about override behavior types, see Add a Mapping.
- In Target group, do nothing. It's an optional field that we don't need in this tutorial. The target group allows us to group mappings together and is important if we are loading records from multiple source systems; for example, if we had data for regular employees in one file and contingent employees in another file. Target groups allow us to load the two sources to the same subject without impacting each other. The target group name is not important in this tutorial because our expense report data comes from the same source system.
- Select Run automap. This automatically maps your source data to objects in Visier through string matching. In the next step, we'll check that everything is mapped correctly.
- Click Create.
Check mappings
After creating the mapping with automapping turned on, we need to validate that the properties are mapped correctly. A property is mapped correctly if it shows the correct source column name or formula. For example, EmployeeID is mapped to the EmployeeID column and not the Birth_Date column.
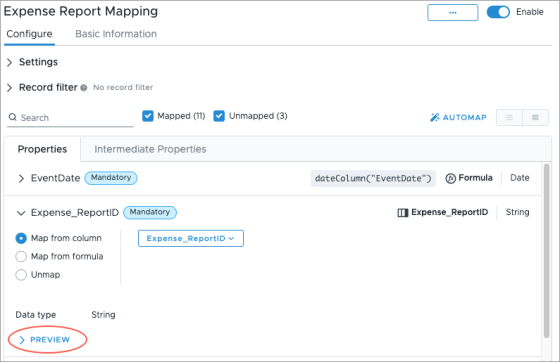
- In Mappings, select Expense Report Mapping.
- In Properties, check the mapped items to ensure the properties are mapped to the correct source columns. In this tutorial, we need to check the following properties are mapped correctly:
- EventDate property is mapped to the EventDate column using the formula dateColumn("EventDate").
- Expense_ReportID property is mapped to the Expense_ReportID column.
- Amount_Due property is mapped to the Amount_Due column.
- Currency_Code property is mapped to the Currency_Code column.
- Date_Approved property is mapped to the Date_Approved column using the formula dateColumn("Date_Approved").
- Date_Created property is mapped to the Date_Created column using the formula dateColumn("Date_Created").
- Date_Paid property is mapped to the Date_Paid column using the formula dateColumn("Date_Paid").
- Date_Submitted property is mapped to the Date_Submitted column using the formula dateColumn("Date_Submitted").
- EmployeeReferenceID property is mapped to the EmployeeID column. This property isn't mapped automatically, so map it now.
- Report_Status_Report_Status_LevelDim_Prop property is mapped to the Report_Status column. This property isn't mapped automatically, so map it now.
Note: This is the automatically-generated property from the Report Status leveled dimension. You may see a different property name.
- Total_Claimed_Amount property is mapped to the Total_Claimed_Amount column.
- If a property isn't mapped, map it to the correct column. For more information, see Add a Mapping.
- In a property, click Preview to preview the records in the mapping.
Note:
- You can ignore unmapped properties that were not included in your data file.
- If using the sample data, you will see a lot of Date format error values in the Preview for Date_Approved, Date_Paid, and Date_Submitted due to empty cells in the data. The sample data is structured so that each status has a different date, such as January 1 for date created, January 9 for date submitted, January 21 for date approved, and February 3 for date paid. In the sample data, if you look at the row where EventDate is January 9, you'll see empty cells for Date_Approved and Date_Paid, whereas Date_Created and Date_Submitted both have values.
Run a job to generate a data version
Once we've created and configured our mappings, it's time to run a job to generate a new data version, this will allow us to preview the data in the solution. Jobs define the tasks needed to load your data into Visier, for more information, see Jobs.
- In the Onboard Expense Report project, on the navigation bar, click Data > Data Categories.
- On your tenant's data category, in the Actions column, click the More button
 . In a previous tutorial, we created a data category named Visier Tutorial Data for our employee data. Since we want expense report included in the same data versions as our employee data, we will select this data category.
 - Click Run job.
- In the Configure Data Loader dialog, click Run job. In this tutorial, we'll use the default job settings.
To check the status of the job, navigate to Data > Jobs. If successful, a release number appears in the Data Version column. This means a data version is generated and the job is complete.
Set the data version
If the data version release behavior is set to manual release or custom release, you will have to change the data version of your project in order to preview the new data version. If the data version release behavior is set to auto-release latest, the data version is already active in your project.
To set the data version:
- In a project, on the navigation bar, click Data > Data Categories. For more information, see Set the Data Version.
Commit project changes
Now that we've generated a data version, it's a good time to commit our changes. Committing changes acts as a save point for your project.
- In the project, on the navigation bar, click the Home button .
- Click the Changes tab in the project home.
- Click Commit All.
- In the Commit Changes to Project Revision dialog, type a name and description for the project revision. We can name our revision Expense Report Data Load with a description of Created mappings and generated data version.
- Click Commit now.
Preview and validate in the solution
Note: If you open the solution experience and can't access any analyses or the Explore room, you may not have the correct permission capabilities. For more information, see Data and Content Security.
Now that we have new data and new objects, let's double check that the data for expense reports is being shown accurately in the solution. This is done by previewing the data in the solution. For this tutorial, we will preview and validate data by building a collection of visualizations in the Analyses room.
Introducing the visual title and analysis context
As part of object creation, we will go through validation steps to confirm that the data is correct by comparing it against the source data. This will involve interacting with visualizations to change the data that is displayed.
Use the various elements to analyze your data and build a visual to suit your needs.
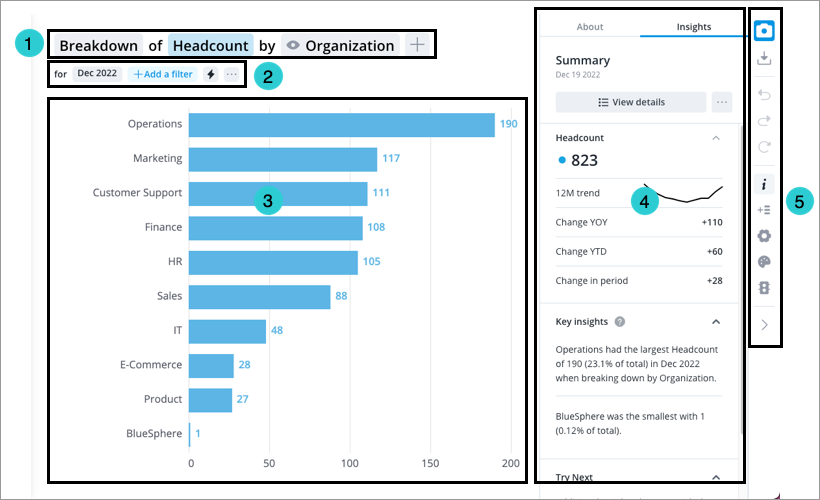
- Visual title: Describes and controls the data that is displayed in the chart. Click the Metric picker, Visual picker, and Group By picker in the visual title to change the data that is displayed. For more information, see The Visual Title.
- Analysis Context toolbar: Change the Analysis Context to select the population and time period for analysis. For more information, see The Analysis Context.
- Chart: Graphical representation of one or more metric.
- Side panel: View contextual information about selected metrics and data points, customize the appearance of your chart, and change chart configurations.
- Visual Actions menu: Use these quick access buttons to perform chart actions and open chart customization and configuration options in the Side panel. For more information, see Visual Actions Menu.
Create an analysis
- In the Onboard Expense Report project, on the navigation bar, click Model > Analyses.
- Click Create Analysis.
- In the Create Analysis dialog, do the following:
- In Display Name, type Expense Report - Validation.
- In Description, type a description for the analysis. In this tutorial, we'll type Validate the Expense Report subject and related objects, but you can write any description you want.
- When finished, click Create.
Next, we can edit the analysis to add visualizations that feature each of our new objects.
- To validate simple properties, you must first capture Detailed View. Do the following:
- In the Analysis Editor, click the Insert button > Chart > Create new chart.
- In the Metric picker, search for and select Total Value of Expense Reports.
- In the Time picker, select December 2023.
- In the Info panel , in the Insights tab, click View details.
- With an expense report selected, in the Info panel , click the Capture button
 .
. - After capturing, we must return to the Analysis Editor and add a chart again. To close Detailed view, click the Close button
 , then click Cancel in the New Chart dialog, and then click Cancel in the Add to Analysis dialog.
 - In the Analysis Editor, click the Insert button > Chart.
- Under Select a chart from your captures, select the Detailed View capture, and then click Add.
- In the Analysis Editor, click the chart card's title to edit it, and then type Validate Expense Report simple properties and click Save.
- In the Analysis Editor, click the Insert button
- To add the Report Status dimension, do the following:
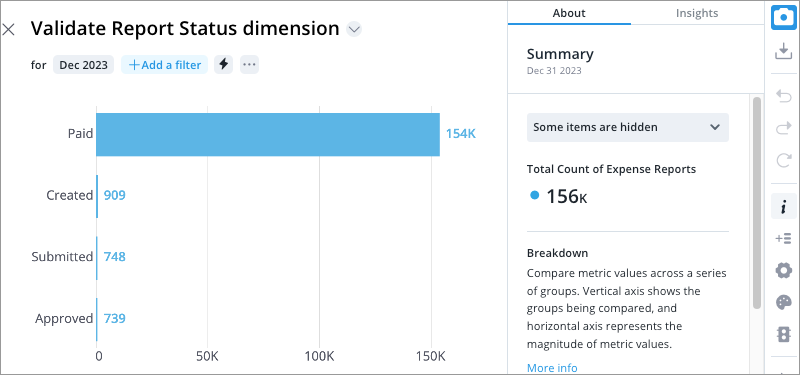
- In the Analysis Editor, click the Insert button > Chart > Create new chart.
- In Add a title, type Validate Report Status dimension.
- On the Visual title, click the Metric picker.
- In the Metric picker, search for and select Total Count of Expense Reports.
- In the Group by picker, search for and select Report Status.
- In the Time picker, select December 2023.
- When finished, click Add and Close.
- In the Analysis Editor, click the Insert button
- To add the Total Value of Expense Reports metric, do the following:
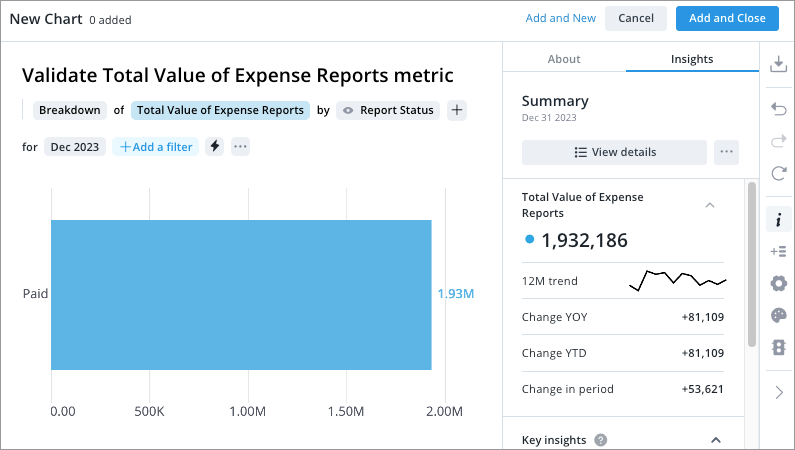
- In the Analysis Editor, click the Insert button > Chart > Create new chart.
- In Add a title, type Validate Total Value of Expense Reports metric.
- On the Visual title, click the Metric picker.
- In the Metric picker, search for and select Total Value of Expense Reports.
- In the Group by picker, search for and select Report Status.
- In the Time picker, select December 2023.
- When finished, click Add and Close.
- In the Analysis Editor, click the Insert button
- In the Analysis Editor, click Done editing.
Now that we're done creating the analysis, we can preview the analysis to validate that the data is correct.
Preview the analysis
With the analysis finished, we can preview it in the solution to check that everything's working as expected.
- In the Onboard Expense Report project, on the navigation bar, click Preview Solution.
- In the solution experience, on the navigation bar, click Analyses.
- Select Expense Report - Validation.
Validate Expense Report simple properties
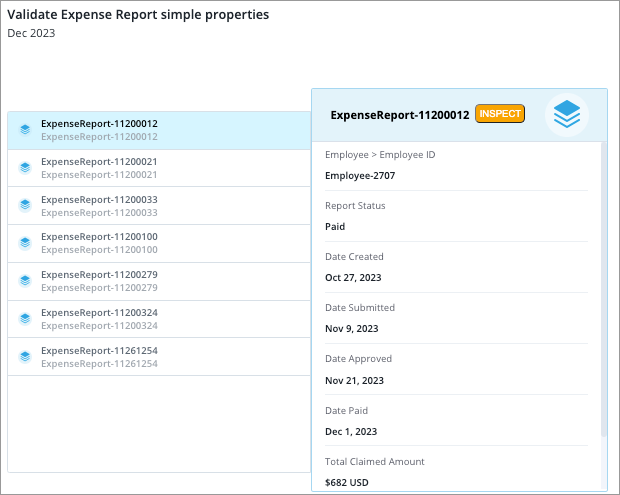
Compare the values for an expense report in the Detailed View capture against your source data. In the sample data, we'll find ExpenseReport-11200012 in Detailed View and compare it against the values in expense_report_tutorial.csv.
- EmployeeID: Employee-2707
- Report Status: Paid. In the CSV, you'll see four values for Report Status. Because its final status in the selected time period (December 2023) was Paid, it shows as Paid in Detailed View.
- Date Created: Oct 27, 2023
- Date Submitted: Nov 9, 2023
- Date Approved: Nov 21, 2023
- Date Paid: Dec 1, 2023
- Total Claimed Amount: $682 USD
- Amount Due: $682 USD
Validate Report Status dimension
Compare the values for an expense report in Detailed View against your source data. In this tutorial, we'll select the Approved group (739) and then click View details in the Info panel. In Detailed View, find ExpenseReport-11437288 and compare it against the values in expense_report_tutorial.csv.
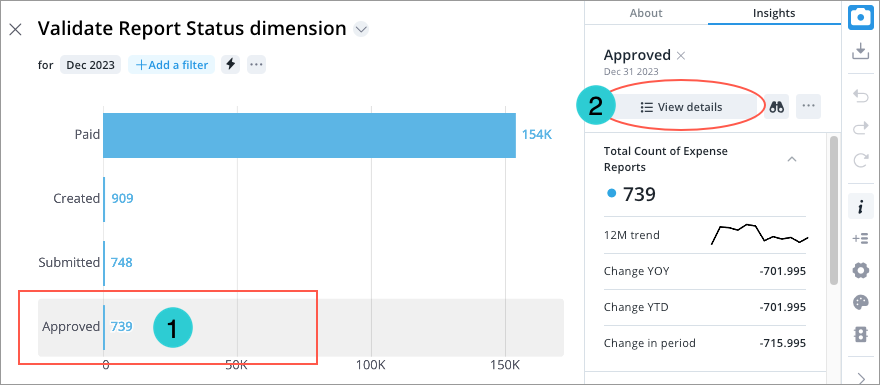
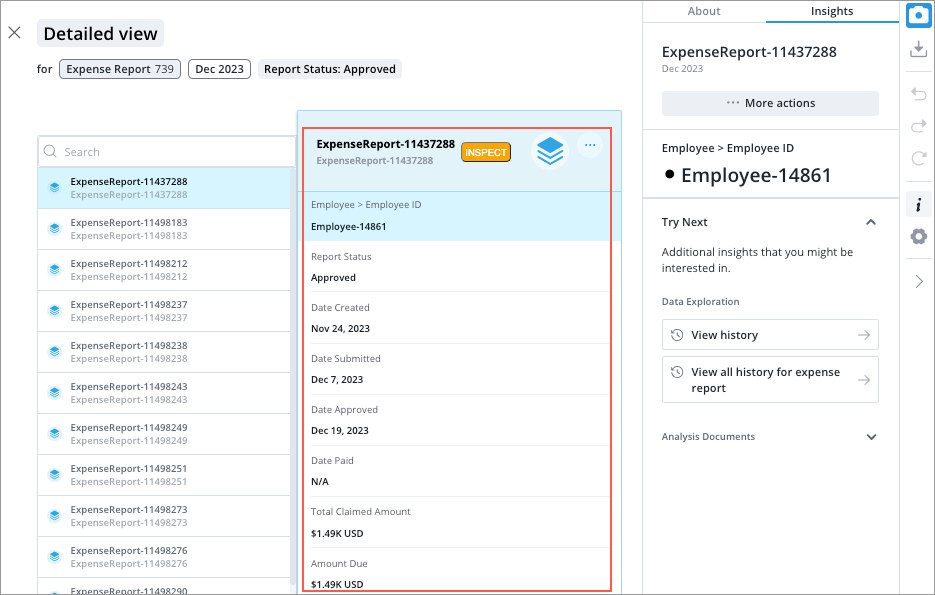
- EmployeeID: Employee-14861
- Report Status: Approved
- Date Created: Nov 24, 2023
- Date Submitted: Dec 7, 2023
- Date Approved: Dec 19, 2023
- Date Paid: N/A. In the CSV, you'll see a Date Paid of Jan 1, 2024. Date Paid is N/A in Detailed View because the time period is December 2023.
- Total Claimed Amount: $1.49K USD. In the CSV, you'll see a Total Claimed Amount of 1493. Total Claimed Amount is $1.49K in Detailed View because Visier rounds large numbers.
- Amount Due: $1.49K USD. In the CSV, you'll see an Amount Due of 1493. Amount Due is $1.49K in Detailed View because Visier rounds large numbers.
Validate Total Value of Expense Reports metric
Compare the total value of expense reports for December 2023 against your source data. Using the sample data, the Total Value of Expense Reports is 1,932,186. You can compare this against the source data by filtering the expense_report_tutorial CSV by Date_Paid dates in December 2023 and then summing all the values in the Amount_Due column.
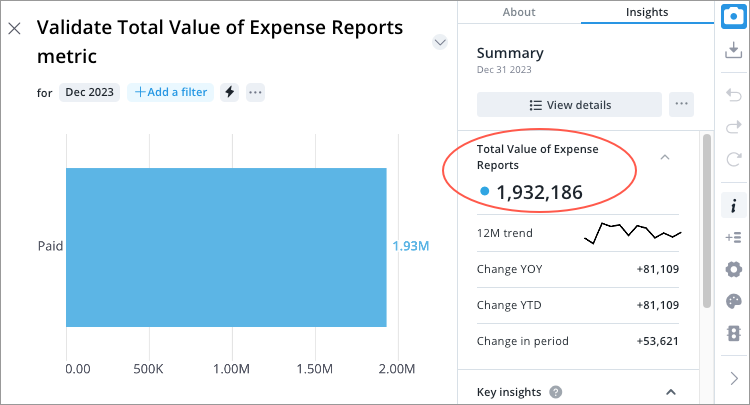
Tip: To see an exact value in Visier, in the Info panel in the Insights tab, click the More actions button ![]() and turn on High precision.
and turn on High precision.
After we verify the new objects are working as expected, we have successfully extended the analytic model in Visier.
Note: If you don't want to publish the analysis you used for validation, remember to delete it before you publish the project.
Publish the project
Now that you've loaded data and set up the analytic model for expense reports, the next step is to publish your project so your changes are available in production.
- In the project, on the navigation bar, click the Home button .
- Click the Changes tab in the project home.
- Commit any uncommitted changes.
- Click Release to Production in the upper-right corner of the project.
- In the Release to Production dialog, type a name, description, and release version, and then click Release now. We can name our release Expense Reports with the description Initial release.
Result: A new production version of the solution is created.
Next steps
Now you know how to create new analytic objects and load data in the Visier solution. This tutorial walked you through how to figure out what objects to create to answer a specific business question, how to create the objects, and how to write a metric formula using those new objects.
After expanding your Visier solution, you can start building analyses about the new metric and objects, or continue creating more objects to answer other business questions. For more information, see Create an Analysis.