
Create a Metric
Learn how to create a metric in Studio.
Access requirements
Profiles: Basic Model Developer
Custom profile with these capabilities: Model (Write, Simple)
Reach out to your administrator for access.
Overview
A metric is a business concern that can be quantified as a number. For example, Headcount, or the number of active employees in your organization, is a business concern (how many people do we have?) that is quantified as a number (we have 5000 active employees). Metrics are based on one or more analytic objects (subjects, events, or overlays) and perform an aggregation to return a result.
To view the metrics in your Visier solution, open a project and navigate to Model > Metrics.
Note:
- Take the Visier University eLearning courses: Creating metrics, Customizing metrics, Creating derived metrics, and Creating metrics with parameters.
- Watch the Visier Formula Language Tutorial Series.
The following image shows the metric interface for authoring and configuring a metric.
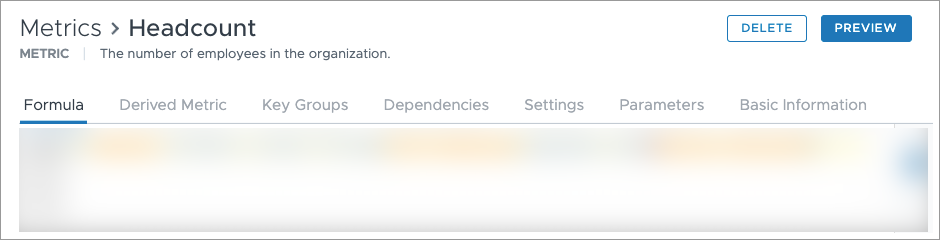
In a metric, the tabs and buttons give you access to authoring, configuration, and validation actions. The following table describes the elements in the metric interface.
| Element | Description | Link to more information |
|---|---|---|
| Formula | A combination of objects and functions expressed as a query that represents the metric. Each metric formula in Visier adheres to a common pattern. You can use the Formula dictionary found in this tab to discover objects and functions to use in your formula. | Metric formulas |
| Derived Metric | A metric that uses an existing metric's formula, but is calculated slightly differently. These metrics are created in the Derived Metric tab of the metric from which they are generated. | Derived metrics (optional) |
| Key Groups | A list of key groups that are related to the metric. These key groups are suggested to users to filter the dataset after they select the metric in the solution experience. Note: These key groups are existing selection concepts. User-created key groups are not available to select as a suggested key group. For more information about user-created key groups, see Create a Key Group. |
Key groups (optional) |
| Dependencies | The objects and content associated with this metric. The metric's ancestor objects are objects that this metric uses, while descendant objects use this metric. Any changes to the metric will be reflected in the descendant objects. View objects in the Dependencies tab to understand the relationship between objects and how changing a metric will impact other objects. | |
| Settings | The features of the metric that you can configure. The settings include the data type, analytic object, additive type, related metrics, and more. | Settings (required) |
| Parameters | A dynamic value that can be changed by the user in the solution experience. | Parameters (optional) |
| Basic Information | The display name, description, explanation, visibility, and tags for the metric. | Basic information (optional) |
| Delete | A button that allows you to delete a metric. Users cannot delete Blueprint metrics, which originate from Visier. | |
| Preview | A button that allows you to view the metric in a visualization without opening the solution experience. Use the Preview button to validate that a metric is working as expected. | Preview a metric |
Create a metric
For a tutorial that walks you through creating a new metric, see Create New Employee Attributes and Metrics.
- In a project, on the navigation bar, navigate to Model > Metrics.
- Click Create Metric.
-
Type a display name and description.
- Optional: Type an explanation to provide further guidance about the metric.
- Click Create.
- In the Formula box, type a metric formula. For more information, see Metric formulas.
Tip:
- Use the Formula dictionary found in the Formula tab to find functions and objects to use in your metric formula. For more information, see Visier Formula Language (VFL).
- For examples of possible metric formulas, see Metric Formula Examples.
- Click Validate. This verifies that the metric formula is valid.
- In the Settings tab, set the data type, analytic object, additive type. For more information, see Settings (required).
- Optional: Add any derived metrics, key groups, other settings, parameters, and basic information that you need to complete the metric. For more information, see Additional metric configuration.
- To check that the metric is working as intended, click the Preview button. For more information, see Preview a metric.
Note:
- By default, new metrics are available to use in the solution experience. If you want to hide a metric, navigate to the Basic Information tab and deselect the Analytics visibility.
- To allow users to see a new metric, the metric must be added to a permission. For more information, see Data and Content Security.
Additional metric configuration
The formula is one component of a metric. You also need to think about derived metrics, key groups, settings, parameters, and the metric's basic information to create a metric that's useful to Visier users. The following sections describe the additional metric configuration options and why you might want to configure them.
Derived metrics (optional)
If you want a variation on an existing metric, like a rate or an average, you can create a derived metric to reuse an existing metric's formula. Derived metrics are created from an existing metric. Depending on the type of derived metric you create, you will either adjust its settings or add a filter to an existing formula. For example, Headcount Percent of Total is a proportion derived metric that uses the same formula as Headcount but a different data type setting than Headcount. Alternatively, Headcount - High Potential is an arbitrary derived metric that adds the filter isHighPotential to Headcount's existing formula.
The following list defines each type of derived metric available in Visier:
- Annualized: Calculate the metric as a yearly value.
- Annualized Rate: Calculate the metric as a rate for the year. This type requires you to set another metric as the denominator for the calculation in Settings.
- Arbitrary: Calculate the metric in a custom way. This is the only derived metric in which you can modify the formula.
- Proportion: Calculate the metric as a percentage of the total.
- Rate: Calculate the metric as a rate. This type requires you to set another metric as the denominator for the calculation in Settings.
Tip:
- To learn more, take the Visier University eLearning course: Creating derived metrics.
- For more examples, see Derived metric examples.
Key groups (optional)
Key groups allow users to filter their analysis results to specific populations. In Studio, a key group is equivalent to a selection concept. For more information, see Concepts. You can add suggested key groups to a metric to provide direction to users working with the metric.
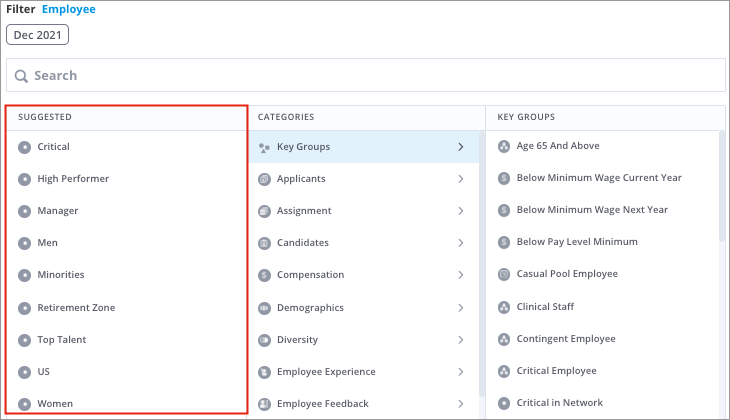
For example, the Headcount metric has several suggested key groups, including High Performer, Women, and Manager. A user who selects the Headcount metric in a visualization will be presented with these groups as suggested filters for the metric in the solution experience, as shown in the following screenshot.
To add a key group to a metric:
- In a project, on the navigation bar, navigate to Model > Analytic Objects.
- Select the analytic object that contains the selection concept you want to add to a metric.
- Click Suggested Key Groups > Add Suggested Key Group.
-
Type a display name and description.
- In the Info panel, click Settings > Edit metadata.
- Choose a selection concept from the list and click Select.
- In the list of suggested key groups, enable the Visible in Analytics toggle.
- Navigate to the metric that you want to add the key group to.
- Click Key Groups.
- Check that the key group shows up in the list as expected.
Settings (required)
Settings provide further configuration to a metric. Some settings are required, while others are optional.
To access the settings for a metric, select a metric and click the Settings tab. You can learn more about each setting in that area.
The following table states whether each setting is required or optional.
| Setting |
Description |
Required? |
|---|---|---|
| Data type |
The data type that this metric outputs, such as outputting values as an integer, a percent, or in months. For more information, see Data Types. |
Required |
| Analytic object |
The analytic object this metric is based on. |
Required |
| Additive type |
How to sum this metric's values, such as:
|
Required |
| Related metrics |
All metrics related to the metric. In the solution experience, Visier suggests this metric as a related metric for each of the listed metrics. |
Optional |
| Trailing periods |
Creates a set of unique metrics that calculate the metric over trailing periods, such as trailing twelve months. |
Optional |
| Drivers visual |
Whether this metric is available in the Drivers visual. For more information, see Drivers Visual. |
Optional |
| Logarithmic |
Whether this metric can be displayed on a logarithmic scale. |
Optional |
| Supported by Collaboration Circle visual |
Whether this metric is available in the Collaboration Circle visual. For more information, see Collaboration Circle Visual. |
Optional |
|
Semantics |
The suggested traffic lighting rules for this metric. For more information, see Configure Suggested Traffic Lighting Rules. |
Optional |
Parameters (optional)
Parameters serve as placeholders in a formula. This allows you to create objects that use different variations in a single object.
Parameters can be one of the following types:
- Numeric: A parameter with a numeric data type. A numeric parameter can be set with an optional default value and value range.
- Member: A filter parameter that can be set with optional dimension member selection.
- Aggregation: A parameter that aggregates property values. For events and subjects, the parameter is set on one property using multiple aggregation functions. For overlays, the parameter is set on multiple properties using one aggregation function.
- Plan: A plan parameter that can be used to select a plan and scenario.
-
Subject Member Set: A parameter which allows the user to select a set of subject members as well as hierarchy values associated with those members.
Note: Limited Availability This feature is in limited availability. If you're interested, contact your Customer/Partner Success Manager. Visier Case Managers can request access by submitting an Enable a Feature case.
If you reference a parameterized object in the formula of a different object, you can set its parameters to a specific value in the new formula.
Tip: For more information about how users interact with parameterized metrics, see Change How a Metric is Computed.
Example: Numeric parameter
Retirement Eligibility has a numeric parameter for Retirement Age because different countries or organizations may have a different age at which employees become eligible for retirement. By using a parameter, you can let your users select an age of their choice for retirement.
When creating the Retirement Age parameter, you would create a numeric parameter and enter the default value and the range of acceptable values, such as 65 and 40 to 80, respectively.
The metric formula would be written as follows:
on Employee filterBy(Employee.Age > AgeParameter) aggregate(count(Employee.EmployeeID))Example: Member parameter
Let's say you want to create a metric called Employee Gender Rate that calculates employees of any gender as a percentage of the total population.
When creating the Gender Filter parameter, you would create a member parameter and select the analytic object, dimension, and dimension members, such as Employee, Gender, and Man, Woman, Unknown, respectively.
The metric formula would be written as follows:
filteredHeadcount := metric(on Employee filterBy(GenderFilterParameter) aggregate(count(EmployeeID)))
headcount := metric(on Employee aggregate(count(EmployeeID)))
filteredHeadcount / headcountExample: Aggregation parameter
Let's say you want to create a metric called Applicants for Requisition that calculates the average, minimum, and maximum number of applicants for requisitions.
When creating the aggregation parameter, you would select the analytic object and then set the default aggregation value by adding a display name, aggregation type, and property. In this example, the analytic object would be Requisition, the default aggregation value would be named Average, the aggregation type would be Average, and the property would be Applicants.
Then, you would add a display name to the aggregation parameter, such as Aggregation Type.
Once created, you would add two more values to the Aggregation Type parameter for Minimum and Maximum. If you want to change the default value, you can select either Minimum or Maximum instead of Average.
The metric formula would be written as follows:
on Requisition aggregate Aggregation_Type_ParameterNote:
- For events and subjects, the new parameter is set on one property using multiple aggregation functions. If you change the property, it will apply to all parameter values.
- For overlays, the parameter is set on multiple properties using one aggregation function. If you change the aggregation function, it will apply to all parameter values.
Example: Plan parameter
Let's say you want to create a metric for a plan model to allow users to analyze data from different plan scenarios.
When creating the plan parameter, you would select the plan analytic object for the plan model, such as Headcount and Cost Planning. When users select this metric in the solution experience, they will be able to select a plan name and plan scenario to set where the plan metric is getting data from.
The metric formula would be written as follows:
on Headcount_And_Cost_Planning_Object aggregate sum(wfp_target_headcount)Example: Subject Member Set parameter
The subject member set parameter is used to establish a target goal against which a source is measured. The source typically contains existing data, such as an employee's current skill and skill level, while the target defines the desired value for comparison, like the goal skill level and the skill's importance. By utilizing this parameter, you can easily pull a collection of subject member values—such as skills on the Skill subject—and compare them directly against an individual employee's skill set. Below we'll walkthrough an existing metric that uses this parameter.
Employee Skill Profile Gap has a subject member set parameter for Skill Profile so that users can select the skills on the Skill subject that they want to include for analysis. This metric compares an employee's skill set to the ones selected in the parameter.
When creating the subject member set parameter, you would select the subject, key dimension, dimensions, and preset subjects, such as Skill, Skill Name, and Skill Level, Skill Importance, and Job, Employee, respectively. The key dimension is automatically selected by the primary key dimension configured in the subject's settings. For more information, see "Primary key dimension" in Create a Subject.
A preset is a list of subjects that have a reference to the subject of the parameter. Users can fill the parameter using presets instead of manually listing out the dimension members. For example, if our main subject is Skill, the Employee subject could be used as a preset if it has data loaded representing employee skills. A user could select an employee to populate the parameter with that employee’s skills and corresponding skill level.
The metric formula would be written as follows:
on Skills_Subject validUntil instant filterBy Skills_Subject.Skill_Level > 0 && Skills_Subject.EmployeeReference.isActiveEmployee aggregate distanceToTarget(EmployeeReference.EmployeeID, Skill_ProfileReference.Skill_Name, Skill_Profile_Parameter, Difference)Example: Setting parameter values in another metric's formula
Let's say you want to create a metric that counts the number of recruiters that have requisitions on hold. You know of an existing parameterized metric that counts recruiters called Recruiter Count With Parameters. It has a Requisition Parameter, which allows the user to select a requisition status to analyze.
For your new metric, you reference the existing metric in your new formula and assign the value isRequisitionOnHold to Requisition Parameter.
The metric formula would be written as follows:
Recruiter_Count_With_Parameters(Requisition_Parameter = isRequisitionOnHold)For more examples, see Parameter examples.
Basic information (optional)
Each metric is made up of metadata that defines more information for the metric. These fields can be changed at any time. The following list defines the fields in the Basic Information tab.
- Object name: A required field that is automatically generated by Visier when an object is created. If you change the object name, its references will update to the new value.
- Display name: A required field that provides a name for the object. This display name is the primary name shown for the object in Visier, such as in the Metric picker or search results.
- Short display name: An optional field that provides a shorter display name for the object. The short display name is used in visualizations if a short display name is provided.
- Description: An optional field that provides a brief, one or two sentence, summary of the metric.
- Explanation: An optional field that provides additional information about the metric, such as calculation details or use cases. If an explanation is provided, users will see a More info button in the solution experience.
- Designer notes: An optional field that provides internal documentation information for other users looking at the object, such as how the metrics work or why it was built in a certain way.
- Visibility: If Analytics is selected, users can view this metric in the solution.
Tip: We recommend writing a description and an explanation to provide further guidance to your users about the metric.
The following image show how the information in Basic Information is displayed in the solution experience.
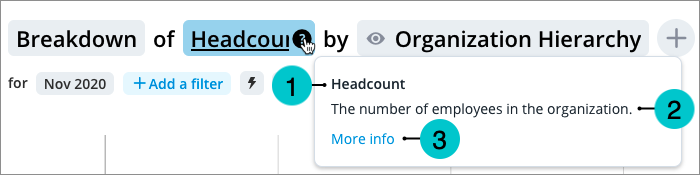
- Display name: The display name identifies the metric in the solution experience.
- Description: The description is a brief, one or two sentence, summary of the metric.
- Explanation: The explanation can be found by clicking the More info button. This brings up a window with additional information about the metric, such as calculation details or use cases. If you did not provide any content in the Explanation field, the More info button does not appear.
Preview a metric
Profiles: Basic Model Developer
Custom profile with these capabilities: Model (Write, Simple)
Data required: Access to data you're previewing
Reach out to your administrator for access.
To ensure that your metric is working as intended, the following conditions must be met:
- The formula is valid.
- The Analytics visibility is selected in the Basic Information tab.
- Relevant analytic objects and concepts have data.
- Relevant concepts are configured.
In a metric, click the Preview button to view it in a visualization and validate that the values are correct.