
Explore
View and build visuals in the Explore room and full screen.
Access requirements
Permission with these capabilities: Ad Hoc Analysis
Reach out to your administrator for access.
Overview
Tip: Watch this video to learn how to conduct ad hoc analysis in the Explore room.
Explore is where you will conduct most of your ad hoc analysis in the solution.
To access Explore, click Explore ![]() on the navigation bar. You can also access the Explore workflow (in full screen) by selecting a chart in an analysis.
on the navigation bar. You can also access the Explore workflow (in full screen) by selecting a chart in an analysis.
Use the various elements to analyze your data and build a visual to suit your needs.
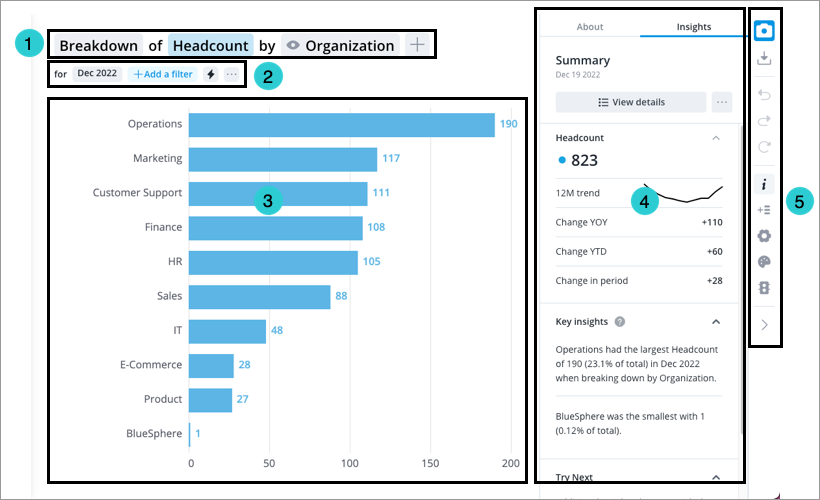
- Visual title: Describes and controls the data that is displayed in the chart. Click the Metric picker, Visual picker, and Group By picker in the visual title to change the data that is displayed. For more information, see The Visual Title.
- Analysis Context toolbar: Change the Analysis Context to select the population and time period for analysis. For more information, see The Analysis Context.
- Chart: Graphical representation of one or more metric.
- Side panel: View contextual information about selected metrics and data points, customize the appearance of your chart, and change chart configurations.
- Visual Actions menu: Use these quick access buttons to perform chart actions and open chart customization and configuration options in the Side panel. For more information, see Visual Actions Menu.
The Explore workflow
Use the following workflow to conduct ad hoc analysis in Explore.
-
Select the metric that you want to explore. For more information, see Select a Metric.
Note: The metric that you select determines the Visual types and group by attributes you can use.
- Select the visual type and the attribute you want to group your data by.
- Set your analysis context by selecting the time period and the population that you are analyzing. For more information, see The Analysis Context.
- Explore your data and view more information about data points in the Info panel. For more information, see The Info Panel.
Tip: Right-click on a chart item or data point to open the Visual Item Actions menu. Find actions that will allow you to quickly interact with points of interest. Actions include drilling up or down to view different levels of your data and accessing the Detailed View visual to see a list of subject members or event occurrences that make up a given population.
- Optional: Add additional metrics, groups, or time periods for comparison by clicking the Compare to button
 . For more information, see How to Create Comparisons.
 - Optional: Use the Visual Actions menu to customize the appearance of your chart in the Side panel. For more information, see Visual Actions Menu.
- Optional: Create a capture of your chart to save your analysis by clicking the Capture button
 . For more information, see Captures.
In this section