Cohort Examples
Learn how to create, define, analyze, and compare cohorts.
Overview
In this section, we'll learn how to conduct cohort analysis to analyze a specific group of employees over time. We will start with creating and defining a cohort, and then build on the example to analyze and compare the cohort. In this example, we will be creating a cohort to analyze the exit count of employees who left the organization shortly after completing a learning item. We will learn how to:
- Create a cohort.
- Define a cohort of employees by using filters, time ranges, and other criteria.
- Analyze the cohort over time.
- Compare a cohort to another cohort.
For a set of best practices when working with cohorts, see Cohorts.
Create a cohort
Let's say you want to create a cohort to analyze the group of employees in your organization who completed a Leading Managers course in January 2019. You are interested in finding out how many of these employees exited the organization within 6 months after completion of the course.
First, you'll need to create a cohort. For more information, see Create a Cohort.
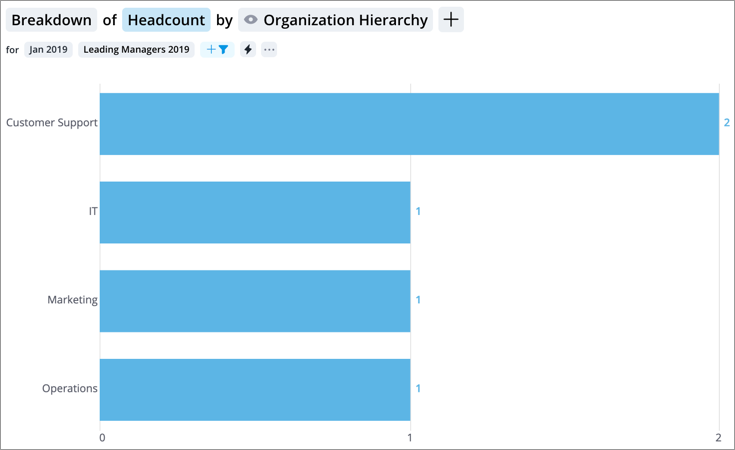
- In the metric picker, select the Headcount metric.
Tip: Always select a metric in the metric picker first as it will determine the subject that defines your cohort. Even if you want to analyze exits later, make sure the metric is Headcount at this time.
-
On the Analysis Context toolbar, click the More actions button
 > Define new cohort.
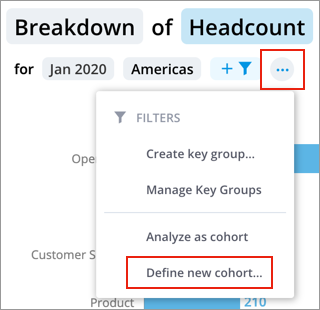
Define a cohort
Next, you'll need to define the criteria for your cohort population. For more information, see Define a Cohort.
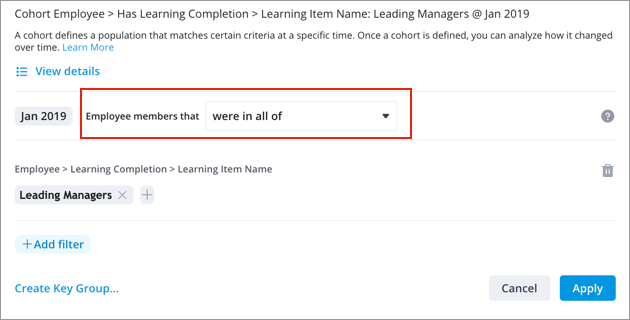
- In the Cohort dialog, do the following:
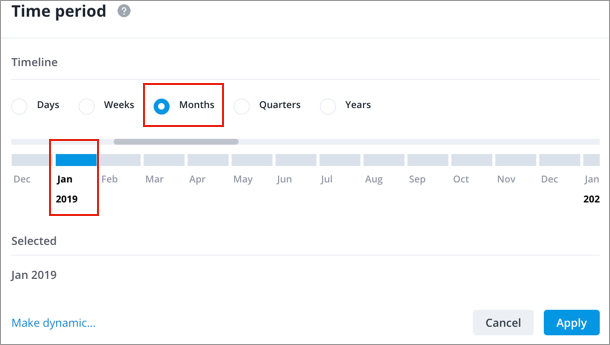
- Click the Time picker and set the time period to Months, select Jan 2019, then click Apply.
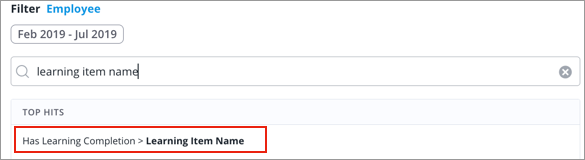
- Click Add filter, search for Learning Item Name, and select Has Learning Completion > Learning Item Name.
- In the list of learning items, select the course you want to analyze. In this example, we will select Leading Managers > Apply.
- In the Complement box, keep the default value were in all of. This will include everyone who completed the course in the time frame you selected. Here, we can see that the correct subject is being used because it says "Employee members that were in all of".
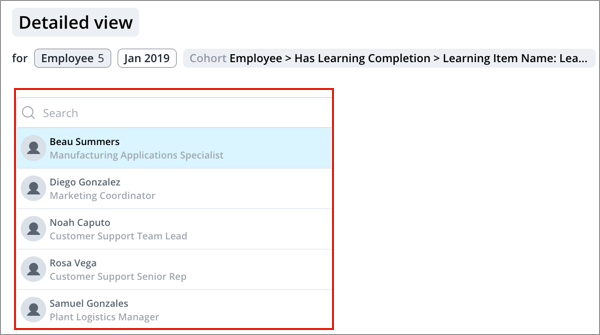
- Optional: Click View details to preview the population that is defined by your cohort. In this example, there are 5 employees in the cohort.
- Click Create key group to save the cohort as a key group for later use. In this example, we will create a key group called Leading Managers 2019. For more information, see Save a Cohort.
- When finished, click Apply.
- Click the Time picker and set the time period to Months, select Jan 2019, then click Apply.
You've created and defined a cohort! Now, you can move on to analyzing the cohort in various ways to gain insights about the group.
Analyze a cohort
In this example, we want to see how many of these employees exited the organization within 6 months after completion of the course.
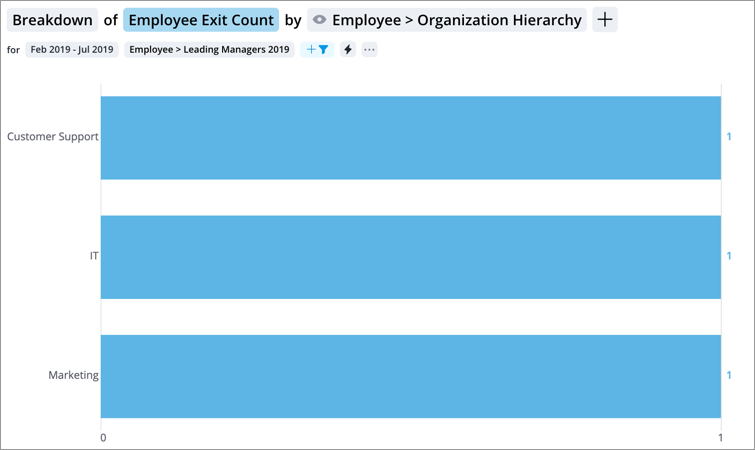
- In the metric picker, select the Employee Exit Count metric.
- Set the time period to Months and select Feb 2019 to Jul 2019, then click Apply.
Tip: Notice that this is the 6-month period after the time period chosen in defining the cohort. This is a standard pattern and practice when using cohorts. The cohort is defined at a particular point in time, but we analyze the group of employees across a different period of time. We usually analyze outcomes of the cohort in a time period after the common event occurred.
In this chart, we can see that 3 out of the 5 employees in the cohort exited the organization within 6 months after completion of the course.
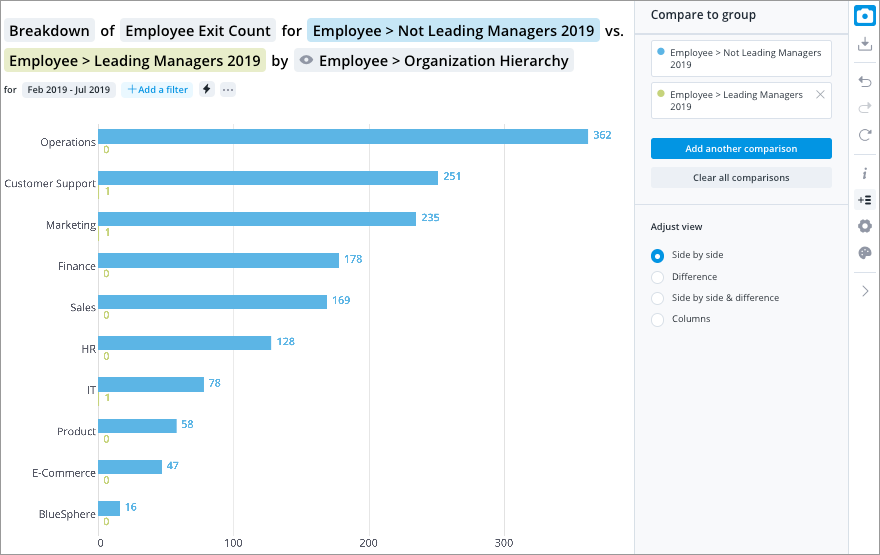
Compare cohorts
To take the analysis further, you can also compare cohorts. In this example, let's say we want to compare exits between our Leading Managers 2019 cohort and those who didn't complete the course. For more information, see Compare Cohorts.
First, we need to create another cohort to compare to.
- Create another cohort by repeating steps 1 to 3c above.
- In the Complement box, change the default value to were not in all of. This will include everyone in the organization who did not complete the course in the time frame you selected, including those who were not eligible such as non-managers.
- Click Create key group to save the cohort as a key group for later use. In this example, we will create a key group called Not Leading Managers 2019.
- When finished, click Apply.
Now, we have created two cohorts to compare. Before setting up the comparison, start fresh by removing both of the cohorts you created from your chart.
- In the metric picker, select the Employee Exit Count metric.
- Set the time period to Months and select Feb 2019 to Jul 2019, then click Apply.
- Click the Compare to button
 on the Visual Actions menu to create a comparison.
 - In the Compare to panel, click Group.
- In the Filter dialog, select Leading Managers 2019.
- In the Compare to panel, click the Overall group, then click Add filter to replace it with the cohort you want to compare.
- Select Not Leading Managers 2019.
You've created a cohort comparison! In this chart, we can compare the exits between the groups. Now, you can compare the two groups in various ways to gain further insights.