
Reports

Leverage reporting to present data in a clear and actionable way.

Overview

Reports are a powerful tool that allow you to efficiently collect, organize, and present data in a clear, tabular format. The ability to generate customizable reports enhances collaboration and transparency across teams. Reports work with Visier's security model to ensure users only see data they are permitted to see. The data security context of the user is applied when they are working with reports.

Reports are categorized as either versioned or non-versioned. For more information, see Create a Report.

  • Versioned reports are created by administrators in a project and published to all users with Reports access.
  • Non-versioned reports are created in the Reports room and can be shared with individual users and user groups.

Manage Reports

The Reports room is where you can create and manage your reports.

Access requirements

Permission with these capabilities: Write Report

Reach out to your administrator for access.

Note: You can assign the View Report analytic capability to provide view-only access to the Reports room.

In Reports, you'll find a list of the reports you can access, as shown in the following screenshot.
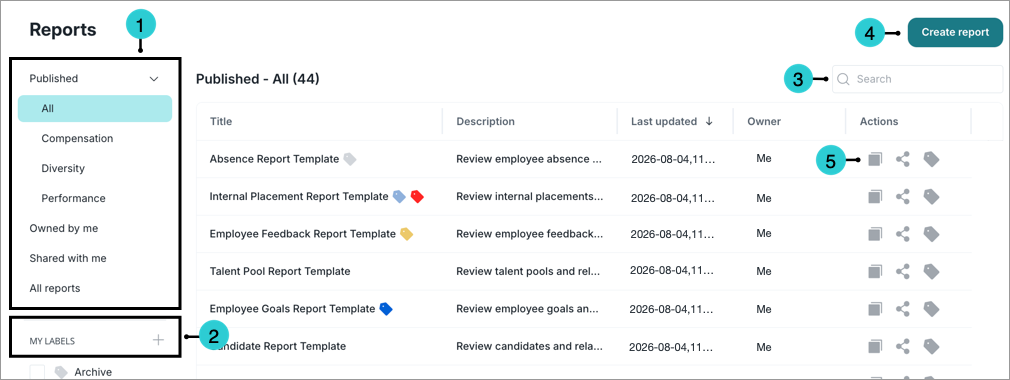
  1. List view options: Switch between the tabs to view a list of versioned reports that are published to production, reports that are owned by you, reports that have been shared with you, and all reports you have access to.

    Note: If tags have been assigned to a versioned report, the tag category appears indented under the Published tab. For more information, see Create and Assign Tags to Content.

  2. My labels: Select labels to quickly filter your list and surface the reports you need. Create and manage labels to organize reports into categories. For more information, see Label a Report.
  3. Search: Find a report by typing the report title, description, or the owner's name.
  4. Create report: Create a new report from scratch. For more information, see Create a Report.
  5. Quick Actions: Duplicate, delete, share, and label a report.

    Note: Users must also have the Share Analysis capability to share reports with other users.

To access Reports, on the navigation bar, click Reports .

Report templates

Report templates are created by Visier experts as part of the Visier Blueprint. The content within the templates is designed to serve as a reference for administrators to explore and validate data to include in reports. Additionally, they allow for customization and adaptation of report designs to fit specific use cases.

Administrators can easily manage templates as versioned reports, which can be published as templates for users or used as standard reports.

Note: You can use tags to categorize versioned reports. For more information, see Create and Assign Tags to Content.

To see your report templates, open a project and navigate to Model > Reports.

You can customize a report template by duplicating it. In the Reports list, select the report template you want to customize, and then click the More options button > Duplicate. You can edit the duplicated report to customize it.

Report templates generally follow a simple design framework, illustrated by the following example.

  1. Title: Subject or Event the report is based on Report Template
  2. Description: Review Subject or Event the report is based on and related attributes.
  3. Time picker: Set to update automatically to latest complete time period.
  4. Columns: Start with the key that represents each individual row. For example, if subject-based, then Subject ID, if event-based, then Subject ID and Event Date. The rest of the attributes are listed in alphabetical order. Columns are organized in alphabetical order so you can easily evaluate the columns you want to keep, exclude, or reorder to address your specific use case.

    Note: Date data types are displayed in a long format by default, for example Dec 13, 2024. To use numerical formatting, such as 12/13/2024, contact Visier Technical Support to enable this feature.

Additional design elements:

  • Suggestions: A small selection of key subject references are configured as suggestions for both columns and group bys to highlight for report users.
  • Filters and group bys: These are intentionally not set so report users can customize them.
  • Aggregation functions: All report templates have a Count aggregation set for Subject ID columns. This helps highlight that aggregation functions are available when report users add a group by dimension. Aggregation functions are not visible to users until a group by is applied to the report. Some columns will have a Sum aggregation set, as these columns often benefit by reporting on the sum grouped by a specific dimension for a more high level view of the data. For example, Actual Base Pay.