Create an Analysis With a Plan Parameter
Create a dynamic analysis to monitor your plans.
With plan parameters, you can create a single analysis that can be used to monitor different plans and plan scenarios for a plan model. When viewing the analysis, the content will automatically update based on the plan and plan scenario that is selected. For more information about dynamic analyses, see Create a Dynamic Template.
Prerequisites: To build and preview your dynamic analysis, you will need access to plans and scenarios in your project. Ensure the created plans use the same plan model as your analysis parameter. In this example, you will be creating a dynamic analysis to monitor plans for the Headcount Forecasting model.
Step One: Create a dynamic analysis with a plan parameter in Studio
- Create an analysis in a project by clicking Model > Analyses > Create Analysis.
- Make your analysis dynamic by clicking the More items button
 > Make analysis dynamic > Edit dynamic analysis properties in the Analysis Editor.
 - Add a plan parameter in the Edit dynamic analysis properties dialog:
- Click Add a parameter in the Parameters tab.
- Select Plan as the Parameter type.
- Enter a Parameter variable name. You'll be using this variable in your formula expressions. In this example, enter annualplan.
- Enter a Parameter display name.
- Select the plan model you want to monitor with the analysis. In this example, select the Headcount Forecasting model.
- Add an analysis transformation to set the analysis context as the plan's overall context:
- In the Edit dynamic analysis properties dialog, click the Analysis Transformations tab.
- In the Analysis filters expression box, enter [ParameterVariableName].getPlanContext. In this example, enter annualplan.getPlanContext.
- Click Save.
When viewing the analysis, users will be able to change parameters to select different plans and plan scenarios from the Headcount Forecasting model.
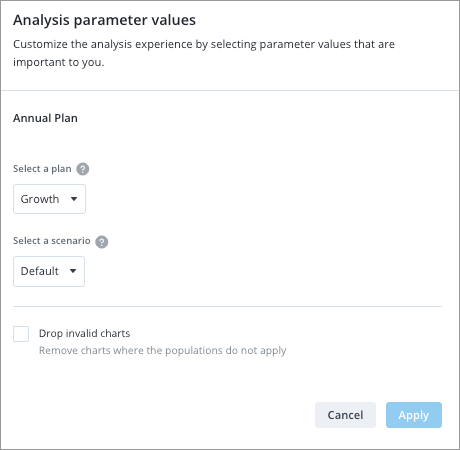
Additionally, the analysis context will dynamically change based on the selected plan and plan scenario.
Step Two: Add visuals to your analysis
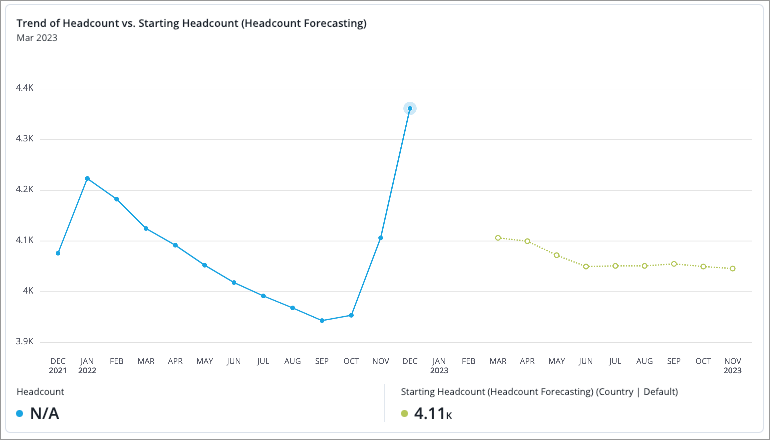
Add visuals that include plan metrics you want to monitor. Ensure the plan metrics are from the plan model that you selected for your parameter. You can select any plan and scenario when prompted. For example, add a visual that compares actual Headcount with the Starting Headcount from a Headcount Forecasting plan.
Step Three: Bind the plan parameter to the visuals
Add a chart transform to bind the analysis parameter value to the plan metric in your visual. By binding the plan parameter your visuals change from a static snapshot into dynamic content.
- Hover over the visual and click the Make dynamic button
 .
. - In the Dynamic chart transforms dialog, add a Set metric parameter value transform.
- Select the plan metric in the visual you want to transform. In this example, select the Starting Headcount plan metric.
- Select the parameter name for the selected metric that you want to set the value for.
Type the parameter variable name into the Value to set box. In this example, enter annualplan.
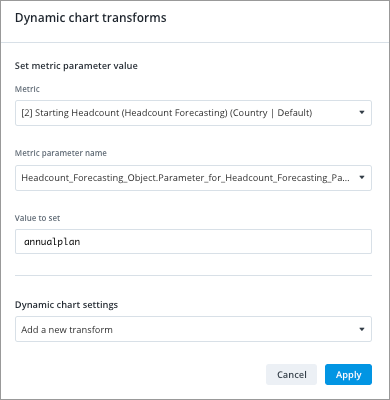
Using the previous visual as an example, you have tied the plan parameter to the Starting Headcount metric. The visual is dynamic because the metric will pull and display data from the selected plan and plan scenario.
Step Four: Add additional chart transforms to your visuals
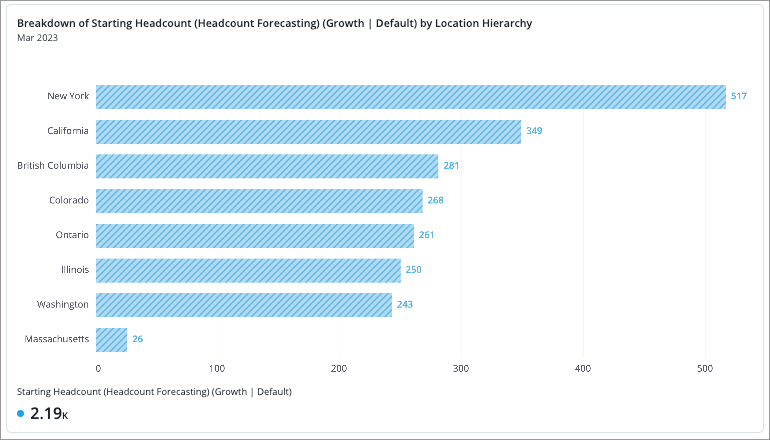
If your visual contains a group by, add a chart transform to change the group by dimension. This allows the visual to consume the group by dimension from the plan parameter. Otherwise, the visual may be dropped from the analysis if the visual's group by dimension is different than the dimension used in the selected plan and scenario. Let's say you have a visual that is showing the planned Starting Headcount grouped by Location.
- In the Dynamic chart transformations dialog, add a Change group by transform.
-
Enter [ParameterVariableName].getPlanDimension. In this example, enter annualplan.getPlanDimension.
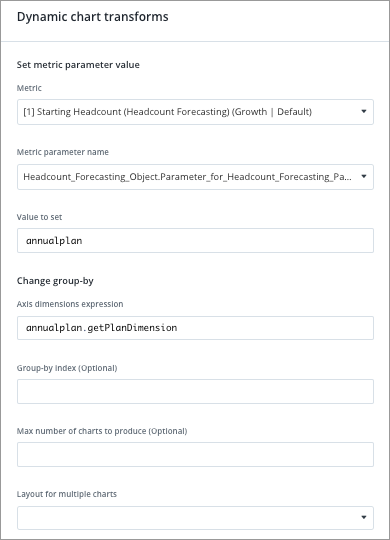
- When finished click Apply.
The grouping used in the visual will change based on the plan parameter. Using the previous visual as an example, let's say the selected plan and scenario is segmented by Organization instead of Location, the visual will show the planned Starting Headcount grouped by Organization.
Step Five: Validate your dynamic analysis
- Click the Preview button in the upper-right corner of the Analysis Editor to see if your dynamic analysis and plan parameter is working.
- Select a user to see what your dynamic analysis looks like as that user. The user should have access to plans and scenarios.
-
The Analysis parameter values tab will appear in the preview tab. Select the plan and scenario you want to analyze and click Apply.

- If successful, the analysis will display data for the selected plan and scenario.
- Try previewing different plans and scenarios by clicking Parameters in the upper-right corner of the analysis. If successful, the visuals will change depending on what plan and plan scenario is selected. Depending on the chart transforms you've applied, you may see different metric values and groupings.
- If visuals are not appearing, you may need to add additional visual transforms. Click the Debug button
 > Show debug information in the upper-right corner of the analysis to see why visuals are being dropped from the analysis.
Step Four: Publish your project
When finished, publish your project to production. For instructions, see Publish Project Changes.
Step Five: Set a plan of record
Define a plan of record in the solution experience to set the default plan and plan scenario that is displayed across your dynamic analyses. For instructions, see Set the Plan of Record.
