
Visier Benchmarks
Compare data about your own workforce to confidentially sourced data from Visier customers.
Visier Benchmarks allows you to compare data about your own workforce to confidentially sourced benchmark data from Visier customers. Visier Benchmarks complements government-published measures such as those from the U.S. Equal Employment Opportunity Commission and U.S. Bureau of Labor Statistics—also available directly within Visier—by adding even more relevant context and timeliness.
The benchmarks that are available to employers today are often incomplete, inaccurate, and out of date because they are based on self-reported surveys that are compiled once a year. Visier Benchmarks are more reliable than surveys that rely on subjective self-reports because workforce information is collected and standardized directly from systems of record. With Visier Benchmarks, you will have access to timely and relevant comparison data.
Note:
-
To get access to Visier Benchmarks, free of charge, your organization must provide its data to our Benchmarking program.
-
The content available through Visier Benchmarks is subject to change based on the data that is available in Visier's Benchmarking program. This includes availability to specific metrics, dimensions, and results.
Visier Benchmarks will include workforce metrics that businesses care most about such as resignation and promotion rates. You will be able to compare your metric results across dimensions like performance groups, tenure ranges, manager statuses, age, diversity, and locations. You can explore an industry benchmark value calculated for your specific industry or an overall benchmark value calculated across all industries.
Benchmark versions
We offer two versions of Visier Benchmarks: Trend and Report.
- Visier Benchmarks Trend should be used for trend analysis and allows you to compare your organization's performance against an accurate measure of change in the market. These benchmarks are directly sourced by aggregating data from Visier customers. New benchmark values are generated quarterly and the historical benchmarks are updated periodically in a new time series.
- Visier Benchmarks Report are easy to use, annual benchmark values that allow you to make reliable point in time comparisons. Historical benchmark report values are never updated and new benchmarks are generated annually from the Visier Benchmarks Trends dataset. We use interpolation to fill in missing values in the data to simplify their usage. Sparsity exists in the Reports dataset because we have insufficient Trends data to create reliable interpolations.
For more information, see Visier Benchmarks Trend vs Report.
Summary of dataset
The Visier Benchmarks dataset was last updated May 2026.
- Benchmark values available: 186,934,746.
- Employee records in dataset: 15,923,661.
The current breakdown of Visier Benchmarks Trend:
- Measured values from Q1 2022 to Q4 2025.
- Extrapolated values from Q1 2026 to Q4 2026.
The current breakdown of Visier Benchmarks Report:
- Measured values for 2017 to 2025.
- Extrapolated values for 2026 and 2027.
Frequently asked questions
Benchmark availability
What metrics do I use to make comparisons to the Visier Benchmarks?
The following table lists the corresponding metric you should use to compare your data to the Visier Benchmarks.
| Visier Benchmark | Comparison Metric |
|---|---|
| Headcount by Age | Headcount Percent of Total |
| Headcount by Ethnicity | Headcount Percent of Total |
| Headcount by Job Function | Headcount Percent of Total |
| Headcount by Tenure | Headcount Percent of Total |
| High Performer Ratio | Headcount Ratio - High Performer |
| Manager Ratio | Manager Ratio |
| Minority Ratio | Minority Ratio in US |
| Promotion Rate | Promotion Rate |
| Resignation Rate | Resignation Rate |
| Women Ratio | Employee Ratio for Women |
| External Starts Rate | External Starts Rate |
| Retirement Rate | Retirement Rate |
| Voluntary Turnover Rate | Voluntary Turnover Rate |
| Involuntary Turnover Rate | Involuntary Turnover Rate |
| Exit Rate | Employee Exit Rate |
| New Hire Minority Ratio | Minority Ratio in US |
| New Hire Women Ratio | Employee Ratio for Women |
| New Hire High Performer Ratio | Headcount Ratio - High Performer |
| 90 Day Resignation Rate of New Starts | 90 Day Resignation Rate of New Starts |
| 1 Year Resignation Rate of New Starts | 1 Year Resignation Rate of New Starts |
| Direct Span of Control | Average Direct Span of Control |
How do I configure and use My Visier Benchmark metrics?
The My Visier Benchmark metrics are automatically filtered by the company size and industry that your organization is classified in. To set up the automatic filtering, you will have to configure the My Visier Benchmark concept in Studio. When configuring the My Visier Benchmark concept, select only one parent industry, not a subindustry. For example, if your organization belongs to the Nursing and Residential Care Facilities subindustry, you must map the concept to the Healthcare parent industry for the metrics to work correctly.
When using the My Visier Benchmark metrics, add a filter to see data for a specific subindustry.
How do I configure the calculation?
Percentiles indicate the values at which a percentage of data falls. Use percentiles to understand where your organization ranks in performance compared to the market at large. For example, your organization's Woman Ratio is 65%, which places you in the 90th percentile of the Visier Benchmarking program. This means that your organization's value is higher than 90% of all organizations.
The default calculation is Average, however, the benchmarks are parameterized to allow you to change the calculation type. Parameterized metrics are metrics that use dynamic values (parameters) in their formulas. When working with parameterized metrics, you can change how the metric is computed by changing the parameter value. The available measures for Visier Benchmarks include:
- 10th Percentile
- 25th Percentile
- Median
- 75th Percentile
- 90th Percentile
For more information on how to change the parameter values for a metric, see Change How a Metric is Computed.
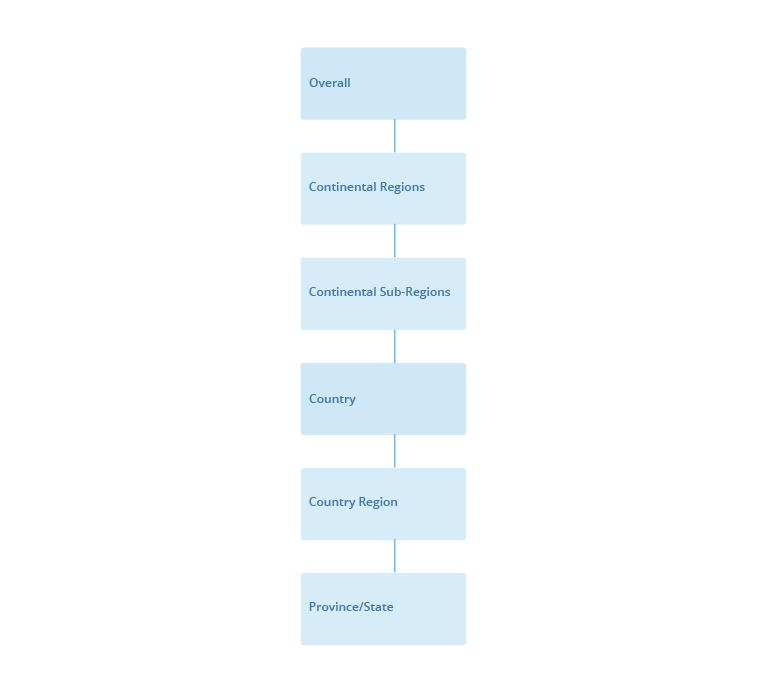
What is the location hierarchy for Visier Benchmarks?
The following diagram illustrates the location hierarchy for the Visier Benchmark data. Certain levels in the hierarchy may not apply to every location. For example, Province/State applies to the United States and Canada only.
What are the supported locations for Visier Benchmarks?
The location data for Visier Benchmarks is based on the location of the employee. Visier Benchmarks includes global results as organizations that are part of the Benchmarking program employ individuals all over the world. Additional locations may be added in the future.
If the Visier Benchmark Location doesn’t match with your organization’s location data, you’ll see an aggregated percentage for the benchmark value across all locations. As a solution, you can filter the Visier Location dimension to a deeper level within the location hierarchy. For example, instead of Continental Sub-Regions, filter to Country.
You can filter the benchmark data to see results for the following locations:
|
Continental Regions |
Continental Sub-Regions |
Country |
Country Region |
Province/State |
|---|---|---|---|---|
|
Northern America
|
|
United States |
United States Regions |
All US states and District of Columbia |
|
Canada
|
Canada Regions
|
British Columbia |
||
|
Ontario |
||||
|
Asia
|
Eastern Asia
|
China |
|
|
|
Japan |
|
|
||
|
South Korea |
|
|
||
|
South-Eastern Asia
|
Indonesia |
|
|
|
|
Malaysia |
|
|
||
|
Philippines |
|
|
||
|
Singapore |
|
|
||
|
Thailand |
|
|
||
|
Southern Asia |
India |
|
|
|
|
Western Asia |
Israel |
|
|
|
|
Europe
|
Eastern Europe |
Poland |
|
|
|
Northern Europe
|
Denmark |
|
|
|
|
Ireland |
|
|
||
|
Sweden |
|
|
||
|
United Kingdom |
|
|
||
|
Southern Europe
|
Italy |
|
|
|
|
Spain |
|
|
||
|
Western Europe
|
Austria |
|
|
|
|
Belgium |
|
|
||
|
France |
|
|
||
|
Germany |
|
|
||
|
Netherlands |
|
|
||
|
Switzerland |
|
|
||
|
Oceania
|
|
Australia |
|
|
|
New Zealand |
|
|
Filters
What attributes do I use to group by or filter the Visier Benchmarks?
You can analyze specific populations by applying filters to the Visier Benchmark metrics. The attributes used for filtering are divided into primary and secondary attributes. You can filter on any number of primary attributes and one secondary attribute. Some metrics, such as Headcount by Age, have a secondary attribute included in the formula and don’t allow for filtering by additional secondary attributes.
Note: The primary and secondary attributes available for each metric vary. For more information about the available attributes for a specific metric, you can download the quality file information in the metric explanation.
The following list includes the set of attributes you can use to group by or filter the Visier Benchmarks:
- Primary attributes:
- Industry
- Company Size
- Location
- Manager Status
- Gender
- Secondary attributes:
- Age
- Tenure
- Ethnicity
- Visier Occupation (available for exit benchmarks only)
- EEOC Function
- Performance Group
What jobs can I filter by?
You can filter by Job Domain, Job Subdomain, or Job Name, but you can’t filter by multiple Job Names at the same time. Filtering by Job Name is available as long as there is data available for the specified job.
Filtering by Job Subdomain is not available for Direct Span of Control benchmarks.
Why can’t I filter by two industries at the same time?
Currently, you can only filter by one industry at a time. For example, you can filter by High Tech or by Manufacturing, but not both at the same time. To make comparisons between two industries, you can put them side by side.
Why can’t I filter by more specific company size categories?
To protect the anonymity of all companies who contribute data to the benchmarking program, we don’t allow for filtering on specific company sizes. The broad filters of 1,000 employees or more and less than 1,000 employees remain relevant and accurate regardless of your organization’s company size, as the data models being used are robust.
For more information about the data that is used to calculate Visier Benchmarks, see Visier Benchmarks Contributions.
Benchmarks data source and calculation
What is the difference between My Visier Benchmark and Overall Visier Benchmark?
When looking at benchmark metrics, you can select between My Visier Benchmark or Overall Visier Benchmark. The My Visier Benchmark metrics are automatically filtered by the company size and industry that your organization is classified in. Let's say we've classified your organization as an enterprise company in healthcare, when you select the Women Ratio - My Visier Benchmark metric, you'll see data that is calculated from other healthcare organizations that have 1000 or more employees. The Overall Visier Benchmark allows you to see values across all industries and company sizes.
How do we classify organizations into specific industries?
Visier maps organizations to industries based on their North American Industry Classification System (NAICS) code or European Nomenclature of Economic Activities (NACE) code.
Note:
- Our industry classes do not necessarily align with the NAICS sectors.
- Organizations may be classified in more than one industry.
The currently supported industries are:
| Industry | Subindustry |
|---|---|
| Accommodation and Food Services | Accommodation |
| Food and beverage services | |
| Financial, Insurance, and Real Estate | Banking |
| Insurance | |
| Administrative and Support Services | |
| Healthcare | Hospitals and Ambulatory Healthcare |
| Nursing and Residential Care Facilities | |
| Social Assistance | |
| High Tech | Traditional Information Services |
| Internet Services | |
| Telecommunications | |
| Professional, Scientific, and Technical Services | |
| Manufacturing | Consumer Good Manufacturing |
| Natural Resource Manufacturing | |
| Chemical Manufacturing | |
| Computer, Electrical Equipment, and Appliance Manufacturing | |
| Other Manufacturing | |
| Other Services | Activities of membership organizations |
| Retail, Wholesale, Transportation, and Warehousing | Retail |
| Wholesale | |
|
Transportation and Storage |
How do we classify organizations according to company size?
Visier maps organizations to a company size category based on employee headcount.
Use the following table to determine which company size category your organization belongs to:
| Category | Description |
|---|---|
| Enterprise | Organization has 1000 employees or more. |
| Small to Mid | Organization has less than 1000 employees. |
What is the source of the benchmark data?
We source our data directly from our customers. Visier Benchmarks data comes from organizations of all sizes, across a span of industries and locations. This diverse dataset provides employers with more relevant comparison points than government data.
For more information about the data that is used to calculate Visier Benchmarks, see Visier Benchmarks Contributions.
Are the benchmarks secure and confidential?
Yes. The confidentiality of the data that is the basis of benchmarks is of key importance. At Visier we use advanced techniques called Statistical Disclosure Control (SDC) to ensure that no confidential information is made public through Visier Benchmarks. We base our SDC methods on the robustly tested methods used by European statistics agencies. Additionally, we apply the following safeguards and practices to ensure confidentiality and security:
- We protect Visier Benchmark data so that information about one specific company can never be extracted. This security applies to every attribute across which benchmarks can be compared.
- Employee-level data does not leave customer deployment, and is only extracted as aggregated data. If an aggregate value has too few employees contributing, the data is discarded and does not contribute to the benchmark generation.
- We do not publish a benchmark data point if too few companies contribute, or the data is overly dominated by large companies. We also ensure that none of the benchmarks that are published could be used to recalculate these hidden values.
How are the benchmarks calculated?
To calculate a Visier Benchmark value, we collect and aggregate the HR metric values from all customers in the benchmark program. It is important to understand that a good benchmark is an average across employees, not companies. Calculating a benchmark as an average across companies can lead to results where one company has an undue influence on the benchmark value because they have much fewer employees than the other companies included in the calculation.
The Visier Benchmark is a weighted average across companies, where the employee headcount of each company is a weight factor. The benchmark value is equal to the metric value calculated from a virtual superset of employee records (the combination of employee records from multiple companies). Therefore, the sample size for our benchmarks is the cumulative employee count across our customers. This approach allows for a true comparison of the employee population that is being analyzed.
How are variations in job titles handled for benchmarking?
Our standardization service automatically matches your unique data to well defined names and taxonomies. This way, your unique data can be used to make accurate comparisons between your organization and benchmarks across your industry. For more information, see Standardizations.
Automatic matches occur when our data enrichment services identify a high confidence score between your data and the standardized data. While standardizing your data, our data enrichment services may not find a sufficient match. Administrators can override automatic matches and manually create standardization matches. For more information, see Override a Standardization Match.
In this section